


Debugging non-responsive SmartForms using Fiddler
kbt134356
PRODUCTK2 Five
SEE ALSODebugging
This article was created in response to a support issue logged with K2. The content may include typographical errors and may be revised at any time without notice. This article is not considered official documentation for K2 software and is provided "as is" with no warranties.
Issue
You have a K2 SmartForms form that is taking too long to respond, or is not responding at all.
This article is meant for helping developers to identify the cause of slow performance in a single form. If ALL your forms are experiencing performance issue, please refer to this guide on how to improve the performance of your K2 SmartForms.
Symptoms
- High CPU & Memory utilization on client computer.
- Browser not responding, or taking too long (e.g. more than 5 minutes) to respond.
Troubleshooting Steps
Very often, the performance of a form is directly related to the SmartForms rules that are being triggered in the form. But as you continue to develop your form, it becomes difficult to track down the exact rule that is causing the delay in your form. Fortunately, there are some tools that you can use to help you identify the rule that is causing the performance issue.
In this guide, we will be using Fiddler to debug your slow loading form. If you are unable to install Fiddler on your machine, you can use your browser's Developer Tools to perform a network trace instead.
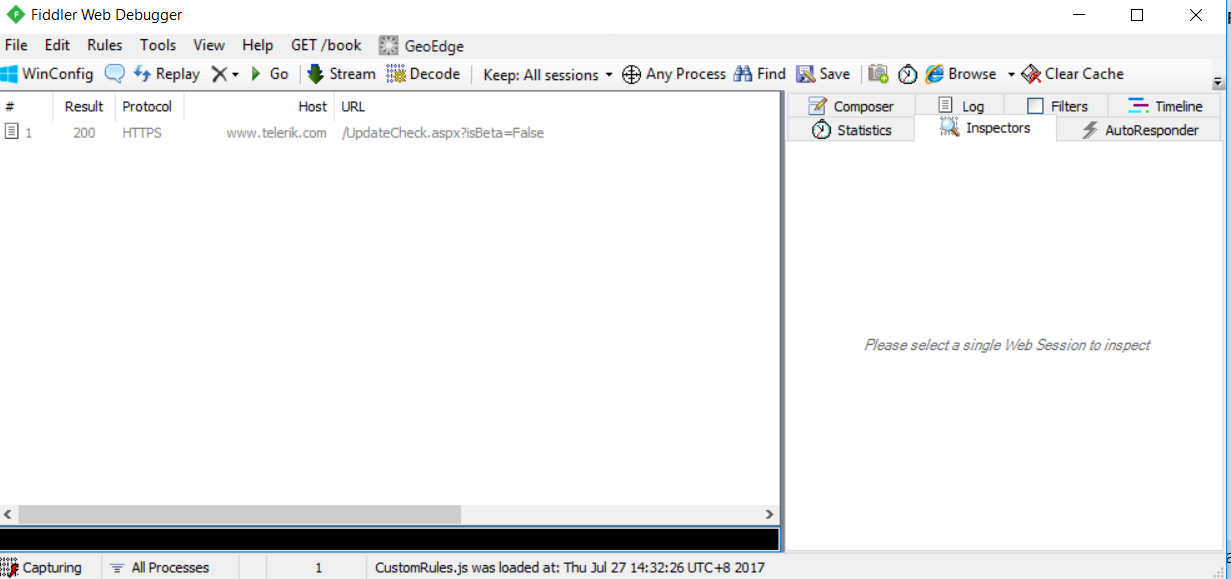
- Once you have installed Fiddler, open your Fiddler to start a network trace.
- Alternatively, if you cannot install Fiddler, open your browser, press F12 to open your browser's Developer Tools, go to the network tab and start a network trace.
Internet Explorer: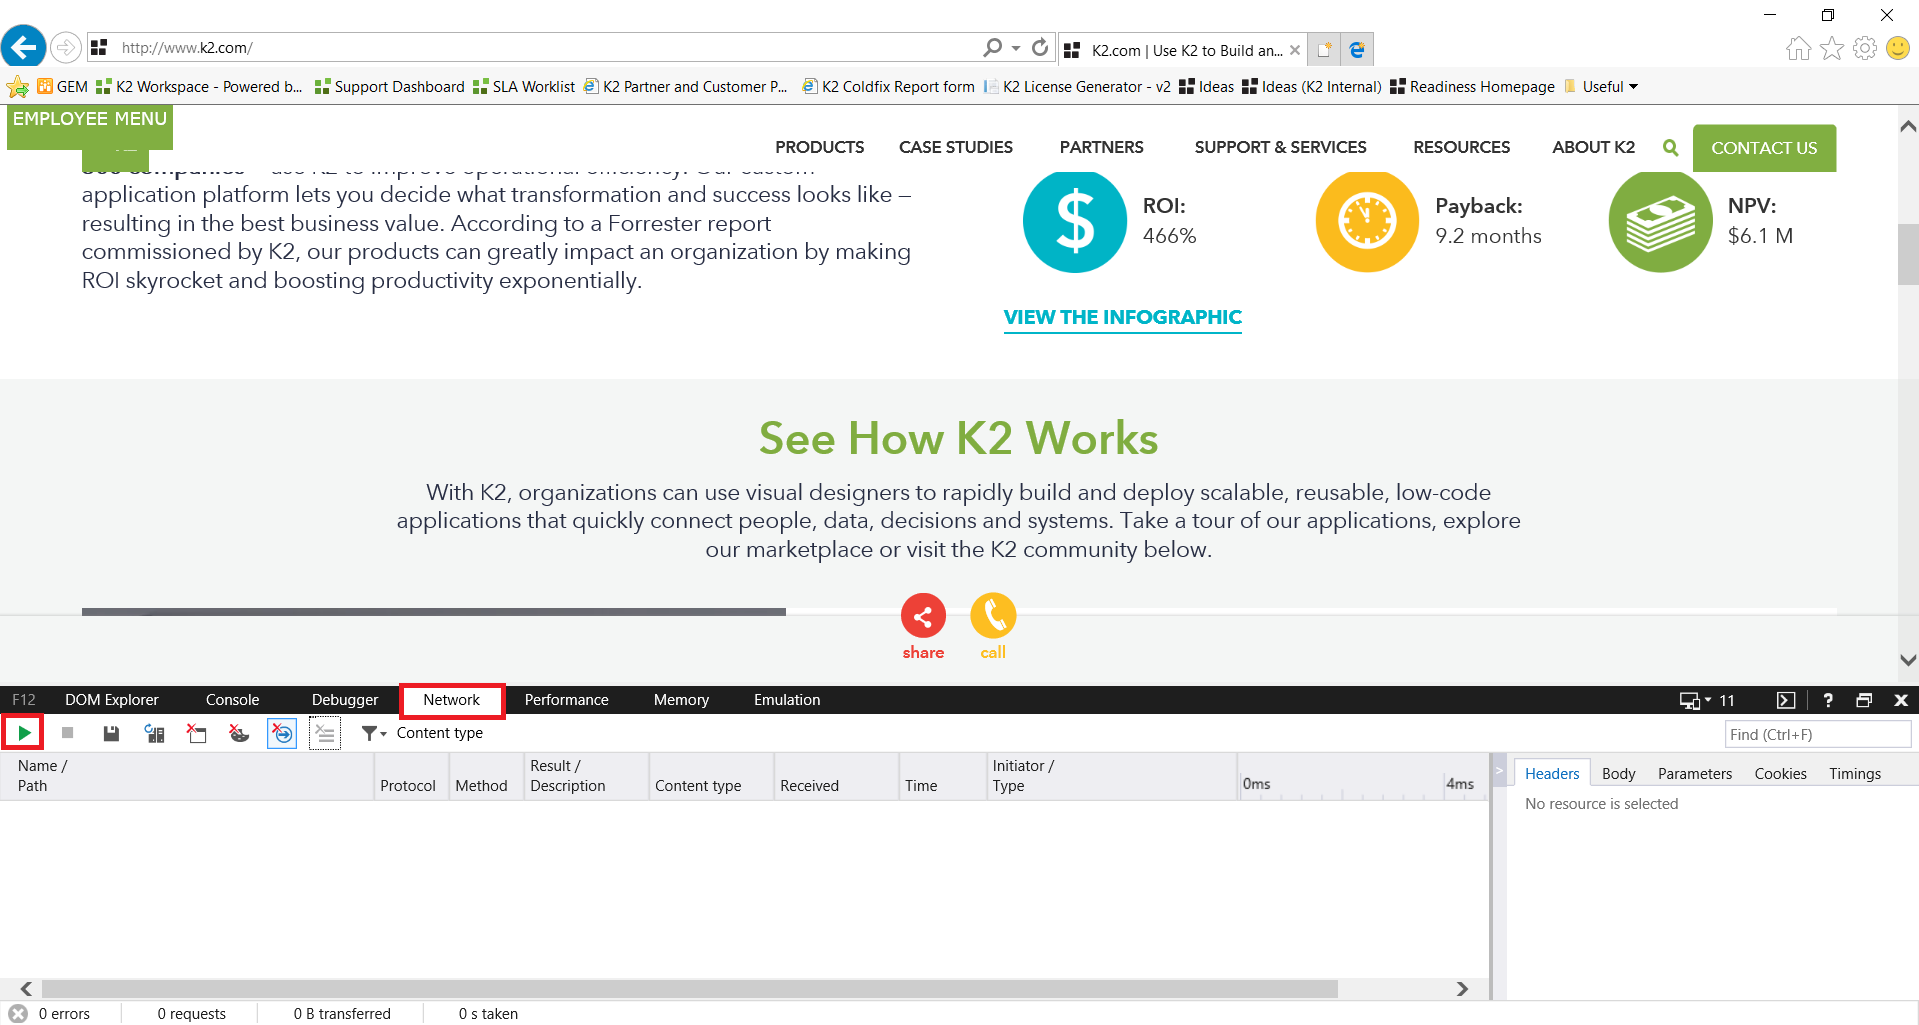
Chrome: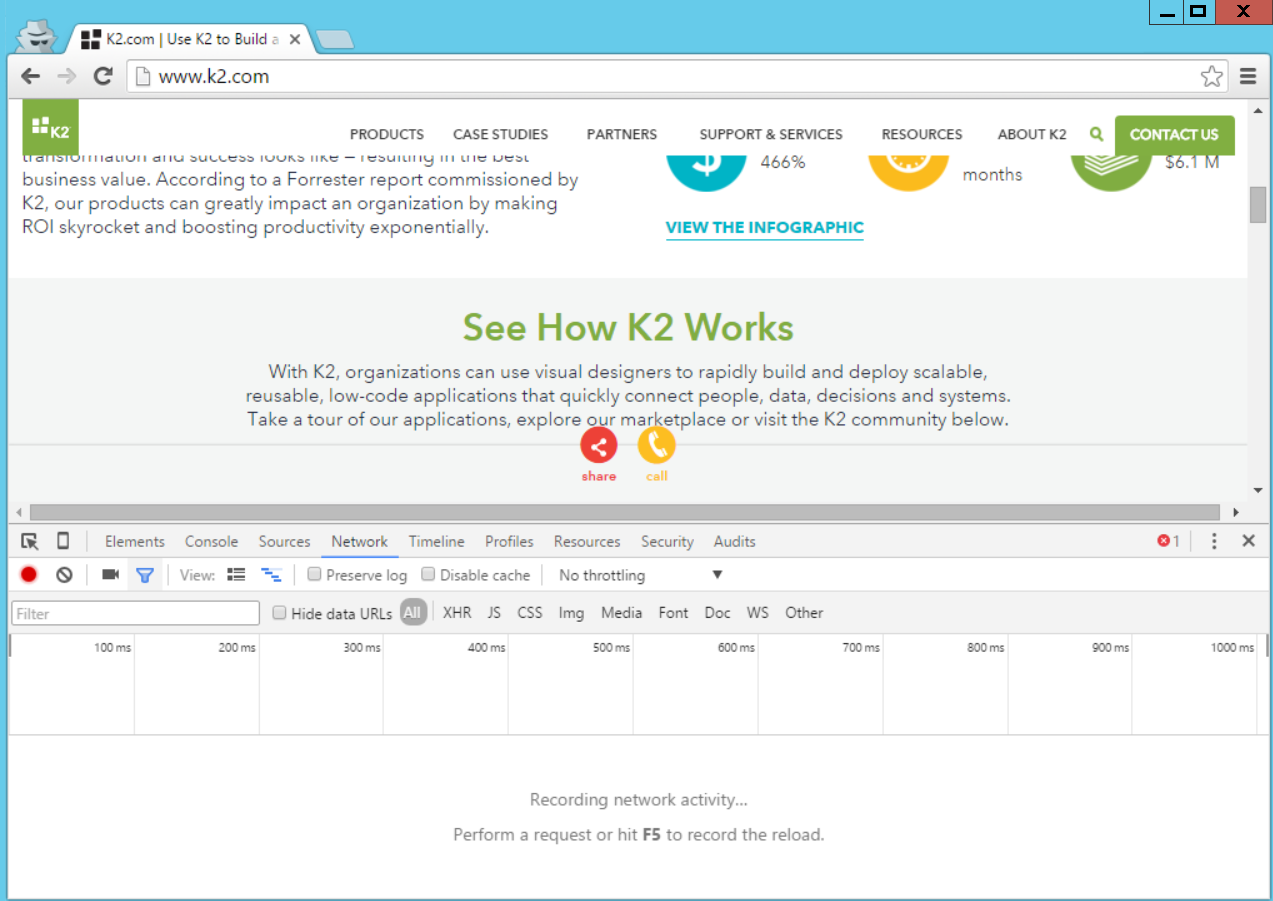
- Open your form in your browser. If your form experiences delays only when you perform certain actions (e.g. clicking on a button), go ahead and perform that action.
- Let your form load, and check if the network traces are being recorded.
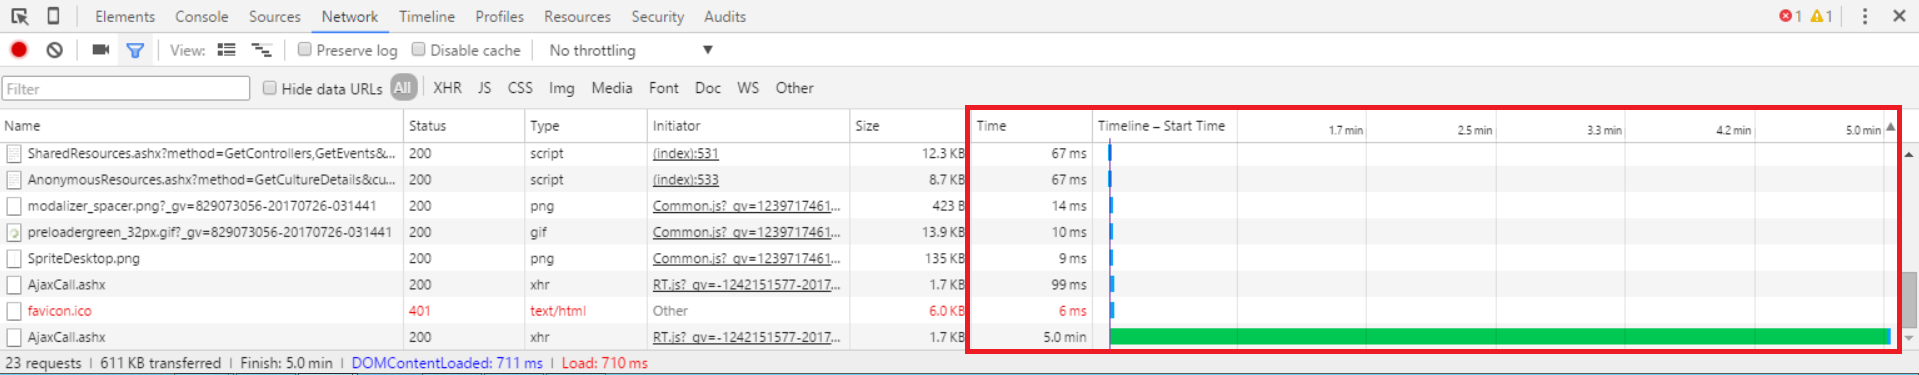
- Once your form has loaded, you can use the timeline to quickly determine the web requests that are taking the longest to respond. In Fiddler, you can view the timeline by selecting all the requests, then clicking on the timeline tab.

For Internet Explorer and Chrome, you can refer to the Time column, or the timeline that is located on the right-most column: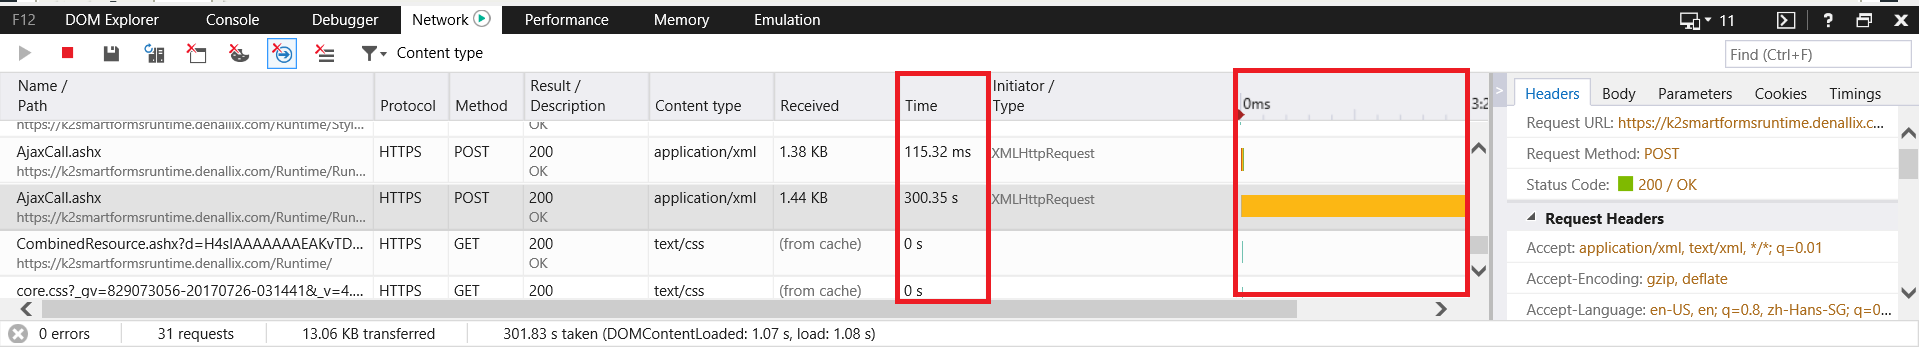
- Next, we want to inspect the request that is taking the longest to respond. In Fiddler, select the request with the longest time, and select the Inspectors tab. You will see two sections here. The top section shows information about the request, and the bottom section shows information about the response that is returned. We want to examine the response, so select the TextView tab from the response section.
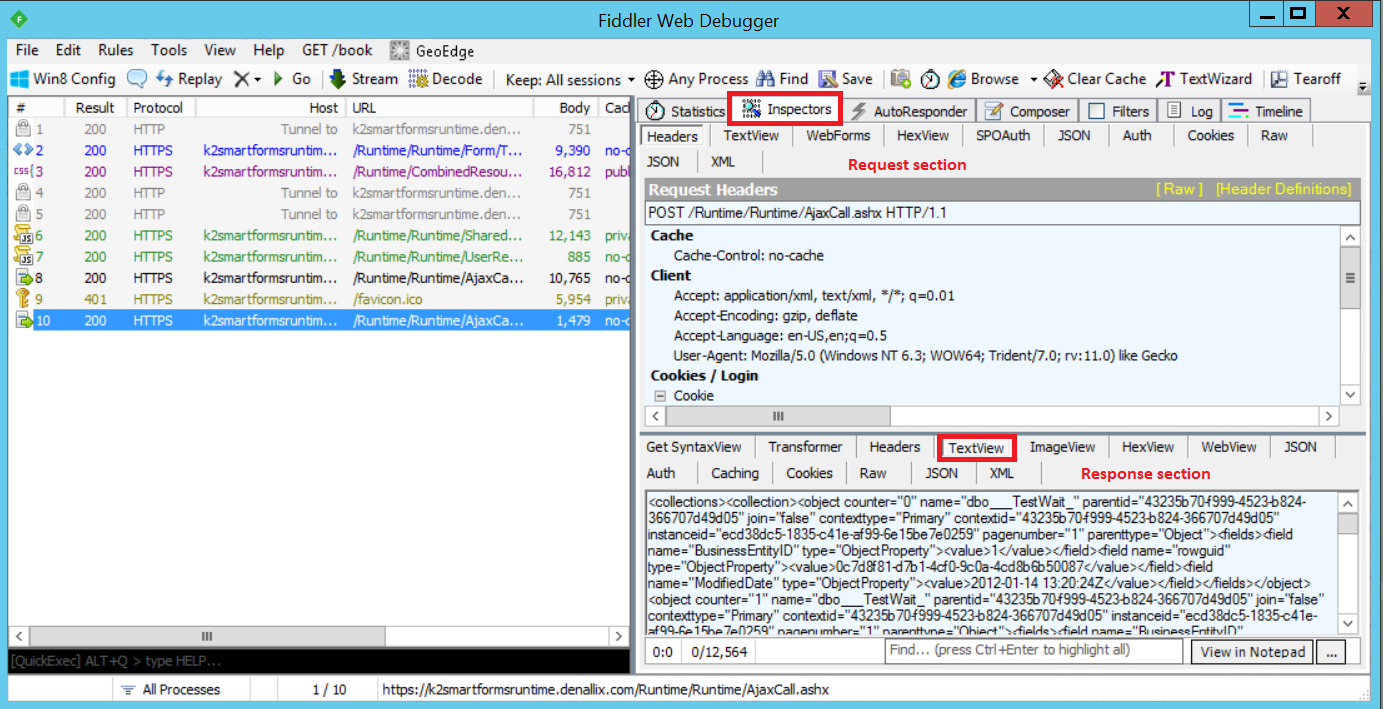
For Internet Explorer and Chrome, you can just double-click on the request to view the request and response details.
SmartForm rules that require interaction with your K2 server usually appears in the form of XMLHttpRequest (xhr) and the filename that makes this sort of request is 'AjaxCall.ashx'. - The response can provide some important clues to help you pinpoint the rule that is causing the delay. For example, the response text shown in the image below tells you the System Name of the SmartObject that is being executed.
The response text returned is a XML formatted text. Copy this text into a XML formatter to easily read the contents of the response.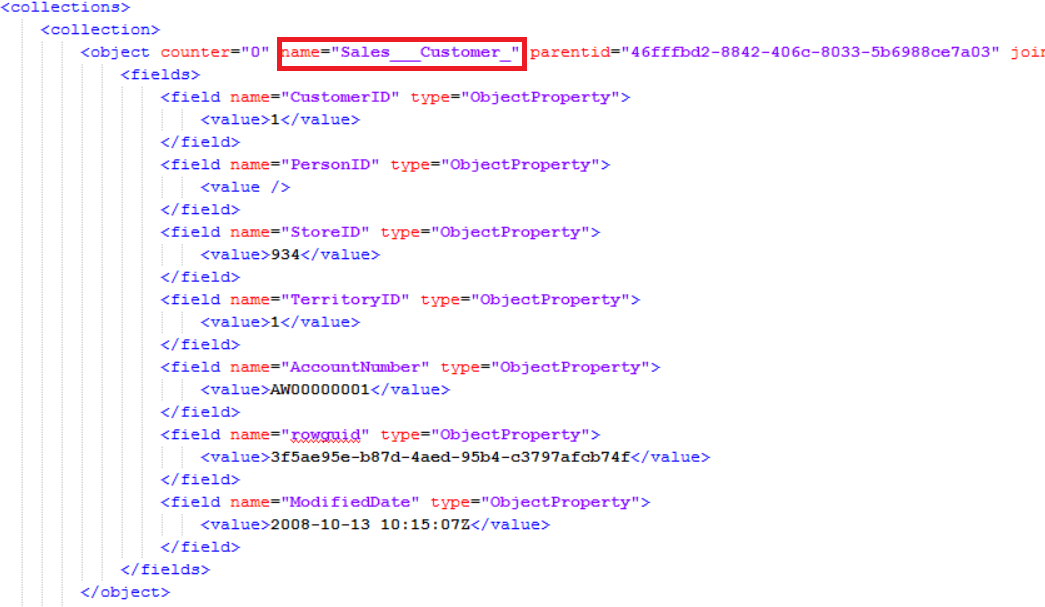
Here is another response of a request that is trying to start a K2 workflow. From the response, you can find the name of the workflow that is being started, as well as the user who started the workflow.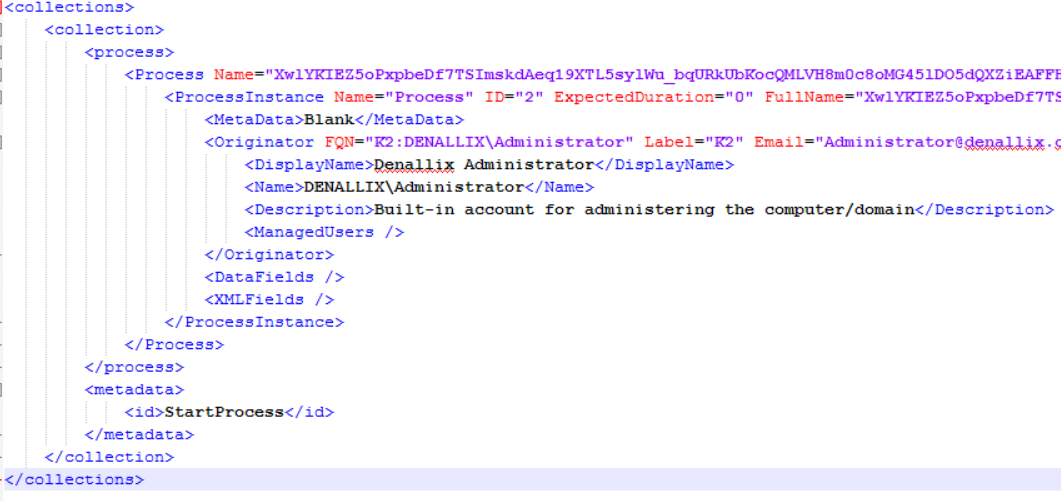
And finally, here is an example of a response returned from a request that is being sent when you try to open a task. From the response, you can easily identify the process, the activity and the event that the task corresponds to.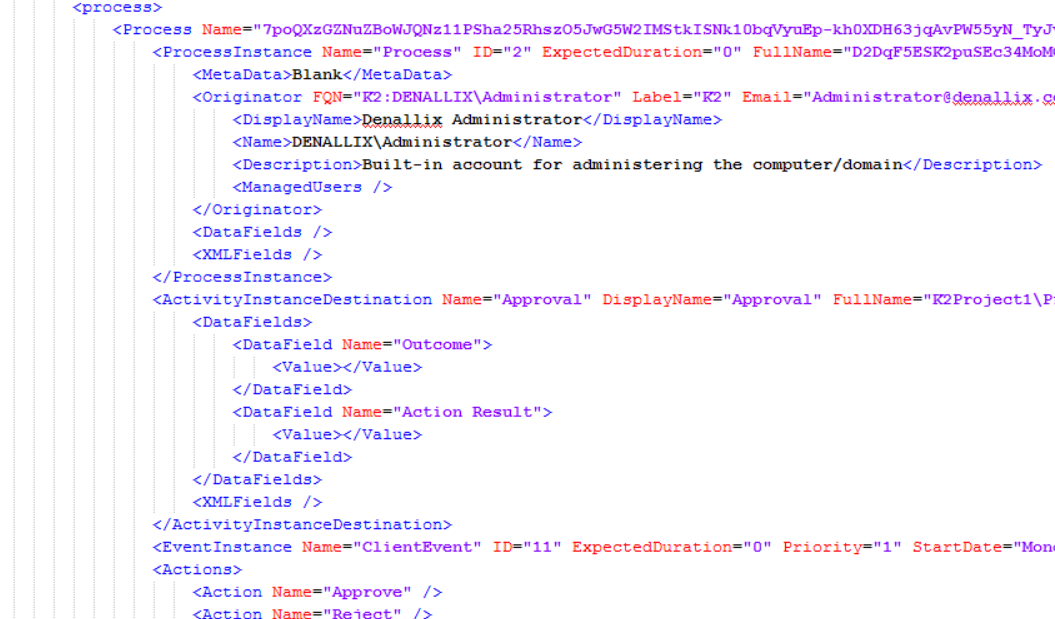
- By examining the response, you can discover information to help you locate the rule that is causing the performance issue in your form.
For example, if the request that is taking the longest time to complete has a response with a collection of results returned from a SmartObject, you can examine the response to obtain the name of the SmartObject, then go back to your form to find the rule that is initiating this request. From there, you can check that rules configuration to determine if you have misconfigured anything, or you can try disabling the rule, and check if the form's performance has improved.