Nintex Community Menu Bar
Question

What % each grouping represent in an aggregate model

  • July 10, 2024
  • 8 replies
  • 3 views
  • Translate

Forum|alt.badge.img+13

Hi,

I’m sure this is possible with a simple solution, but for some reason my brain won’t work properly today 😃

I have an aggregate model, and there’s a grouping on it (field: status)

I want to find a way to show what % of grand total each ‘group’ represents

So as per example SS below , there’s a total of 73 records
and i want each line (or group) to show % of grand total (73) it represents
So 1st line (approved) would show 48% …

Any simple way to accomplish this?

Thank you

Did this topic help you find an answer to your question?
This topic has been closed for comments

Forum|alt.badge.img+10

I think it’s just one of those days Dave.

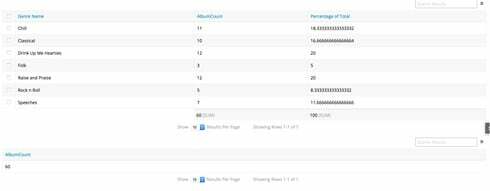
I was able to build this pretty simply:

I made two models.

The first model was an aggregate counting the sum total of the albums.
The second model was an aggregate counting the sum total of the albums grouped together by Genre Name.

Then I created a UI Only field on the second model that used global merge syntax in a formula field to pull the ‘60’ album count. The formula was pretty simple. I’m fairly certain there are other ways that could accomplish this, but I like this one.

Thanks for bringing this up. Let me know if you have any questions on the build.

Translate

Forum|alt.badge.img+10

You could put the entire formula in the function ROUND() if you wanted whole percentage points. That might be prettier.

Maybe add   + ‘%’   to the end in order for it to look extra purdy.

Translate

Forum|alt.badge.img+13
  • Scholar
  • July 10, 2024

That’s perfect Stephen, I tried something similar , but see i messed up on syntax on global merge syntax from other agg model 🙂

Translate

Forum|alt.badge.img+10

Happens to me all the time. Glad I could be of help.

Translate

Forum|alt.badge.img+2

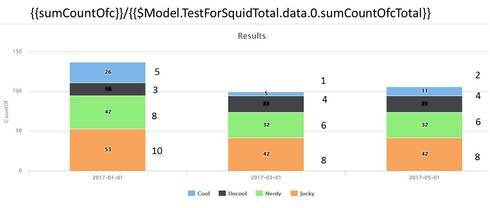
I have setup a column chart with a series (by month) showing up to four stacked values per month. The values are meant to be the “percent of total” scenario mentioned here. The totals are never coming up correct and the reason is eluding me. Has anyone else every gotten this to work in this fashion (versus the table scenario mentioned above)?

Here is a quick pic of the scenario and the formula I am using with the two aggregate models…

Translate

Forum|alt.badge.img+2

btw, the numbers on the right are the actual counts that should be used to calculate the percent of total… for instance the ‘53’ in the first column should be 38.5%

Translate

Forum|alt.badge.img+18

Neil,

The problem here is that you need a different total for each month. I’m guessing your TestForSquidTotal model is just getting the total all the data, not the total for each month? Or if it is getting month, you’re only getting the first month (row 0).

Translate

Forum|alt.badge.img+2

Ya, thanks Matt… Is there a squid formula/syntax guide?  I expect there is one ?

Translate

Cookie policy

We use cookies to enhance and personalize your experience. If you accept you agree to our full cookie policy. Learn more about our cookies.

 
Cookie Settings