Hi, all. I’m hoping you can help. I’m just starting to try to solve this problem and am researching the best approach. I’m building a table that I’m hoping to use to aggregate the results of different model conditions and so far what I’m coming up with seems needlessly complex.
What I’d like to display is:
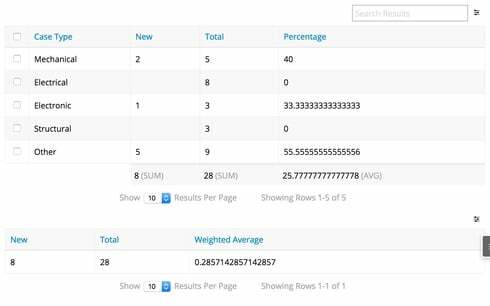
Requests || New || Total || % Service 1 || 1 || 10 || 10.0% Service 2 || 4 || 16 || 25.0% TOTAL || 5 || 26 || 19.2%
I built an aggregate model to show all requests that were received in the given time period and another to display all of them that were in New status. I don’t know how to get them in the same row or add the percentage UI-Field formula so that it will perform the calculations on each row rather than overall.
Any suggestions? Thanks in advance for your help.