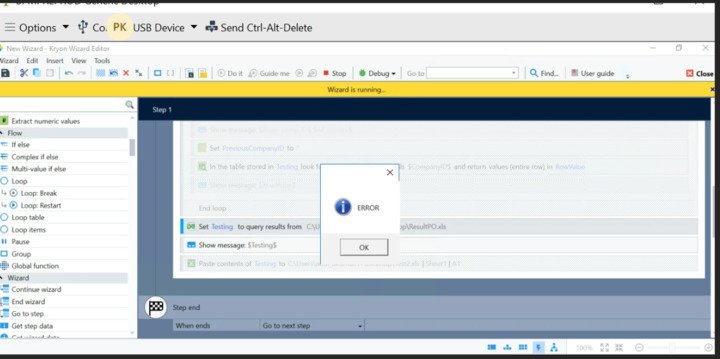
Thanks to an article from @Mark Lim https://community.kryonsystems.com/s/article/Automation-Lifecycle-Step-by-Step-Walkthrough-Chapter-2-Customer-Feedback-Collection-Analysis-and-Reporting#2 and https://community.kryonsystems.com/s/question/0D50600007PQU2rCAH/db-logging
we actively use custom monitoring in all our wizards and user wizards, initially monitoring was laid down as logging of standard errors in work, which are embedded in error bypasses and the wizard's basement
Window not found, object not found, etc.
expanding the function a little, namely, adding two more global functions, custom messages, i.e. you can add a global function anywhere in the wizard, pass the logging variable inside at any step and write any text you need in it and the value of the variable will be written to the same table where logs with errors are written and added a second function, custom error , which can be added anywhere, for example, in the if else condition, if the condition is not met and the robot needs to complete its work, then an error will be marked through f-th and also written to the log table
And then we display our logs in grafana and you can see online what the robot is doing, for example, at each step we add our custom function custom logging after each key point and as soon as the key point of the wizard passes and our global function is executed and the required one is written to the table line with the text the user needs, then this log will immediately be displayed in grafana.
This dashboard can be distributed to all users who are developing wizards and they can track what is happening at the moment the wizard is being executed.
Now there is no need to keep log files on each server and go to see what is written in the logs.


