

I have created a form which will then generate a document later in the process.
Within the document (a customer report) I would like to include graphs which represent the data the customer input into the form at the beginning. I have tried the standard insert graph in word (in my case a pie chart) and used the document tagger to input the field information from the form into the excel data for the graph in word but it doesn't work.
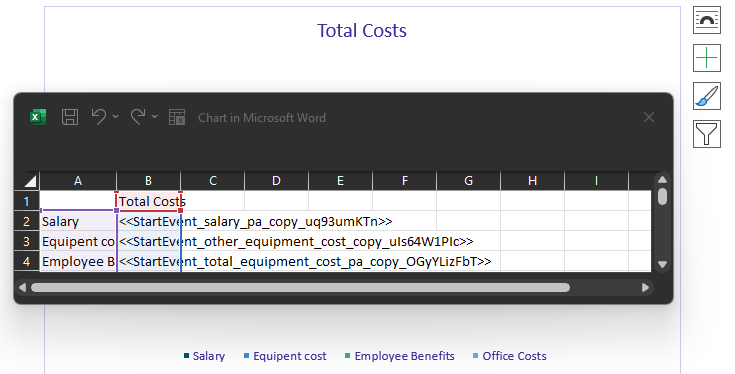
Does anyone have any ideas please?
