On a project I’m working on I had to embed a gantt chart. After some research I found a few JS gantt libraries, which didn’t turn out of much value. Until I found the DHTMLX Gantt Chart library. It’s for free and a pro-version can be bought (I just used the free version, it offers all the functionality I needed).
In order to embed the gantt chart you will have to do the following:
-
Download and unzip the DHTMLX Gantt Chart (you can get it here)
-
Upload the libraries and the css you need to use (in my case dhtmlxgantt.css, dhtmlxgantt.js, ext/dhtmlxgantt_marker.js, ext/dhtmlxgantt_tooltip.js) as static resource (if you want you can also upload any theme from skins/ but then you don’t need the standard css).
-
Include the static resources in your skuid pages and make snippet in which you initialise the chart.
-
Make a template field with the following content (very important: do not select a model! If you do so, the chart will be rendered every time you change some values on the gantt chart. And you might want to alter the style):
In my case, the gantt chart is on a tab view. That’s why there is a script-tag required. If you have the gantt chart on a page which loads on pageload, you can just delete that script and make an inline snippet.
5. Create a snippet where you initialise the chart (I’m not going to post the whole script at once, I will just guide you through it step by step):
5.1: Declare stuff you will use later (like models, objects, arrays and so on…). :
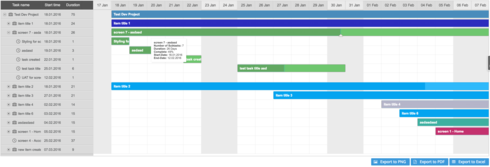
var $ = skuid.$, data = [], //data array later used to display on the gantt chart, contains objects startDate = new Date(), //date declarations in order to display the format in the european way endDate = new Date(), duration = 0, //duration of the task displayed on the gantt chart (in days) progress = 0, //the progress of each task ganttItem = {}, //an empty object (for now) which contains all the properties for the gantt chart to display itemsModel = skuid.$M('the\_project\_tasks'), tasksModel = skuid.$M('the\_project\_substasks'), projectModel = skuid.$M('the\_project\_model'), //the top most item (in the picture "Test Dev Project") project = projectModel.getFirstRow(), projectStart = new Date(project.Project\_Start\_\_c), projectEnd = new Date(project.Project\_End\_\_c), one\_day=1000\*60\*60\*24; //one day in ms (used for duration calculation) projectStart.setHours(0); //"format" the start and end date. The gantt chart shows hours, so if you need to display the hours you can leave that out projectStart.setMinutes(0); projectEnd.setHours(24); projectEnd.setMinutes(0);
5.2: Declare a function which assembles the data items:
//returns an object with all the properties needed for the gantt chartfunction
assembleDataObject(start, end, text, comp, id, parent, color){
    endDate = new Date(end);  startDate = new Date(start);     progress = comp / 100;

    if(!isNaN(startDate.getTime()) && !isNaN(endDate.getTime())){ //this'll prevent the gantt chart from breaking and displaying errors (about start date being not a date). If you can guarantee that there won't be empty dates you can leave that out
        startDate.setHours(0);
        startDate.setMinutes(0);
        endDate.setHours(24);
        endDate.setMinutes(0);
    return {
        id: id,
        text: text,
        start\_date: startDate, //the start date
        duration: calculateDuration(startDate, endDate), //there is no end date, just a number of days (duration) which the chart then automatically calculates the end date
        progress: comp / 100, //the progress is a decimal number 1 = 100%, 0 = 0%
        open: false, //defines wether the task is collapsed on rendering or not
        parent: parent, //the parent task
        color: color //the color in which the task is displayed (hex or some other value)
    };
    }
}
5.3: Declare some other utility functions:
//requires start and end to be a js date
function calculateDuration(start, end){
    return Math.ceil((end.getTime() - start.getTime()) / (one\_day));
}
function updateSowModels(){
    skuid.$M('SowItems').updateData();
    skuid.$M('SowTasks').updateData();
}
//returns an object with the appropriate sow model and record
function getSowRecordAndModel(id){
    var retObj = {},
        project = projectModel.getRowById(id),
        sowItem = itemsModel.getRowById(id),
        sowTask = tasksModel.getRowById(id);
    if(project){
        retObj.model = projectModel;
        retObj.record = project;
        retObj.prog = project.Items\_Complete\_Percent\_\_c;
        retObj.noOfComps = project.No\_Project\_Items\_\_c;
        retObj.text = 'Name';
        retObj.start = 'Project\_Start\_\_c';
        retObj.end = 'Project\_End\_\_c';
    } else if(sowItem){
        retObj.model = itemsModel;
        retObj.record = sowItem;
        retObj.prog = sowItem.Components\_Complete\_\_c;
        retObj.noOfComps = sowItem.No\_Components\_\_c;
        retObj.text = 'Project\_Component\_\_c';
        retObj.start = 'Component\_Start\_Date\_\_c';
        retObj.end = 'Component\_End\_Date\_\_c';
    } else if(sowTask){
        retObj.model = tasksModel;
        retObj.record = sowTask;
        retObj.comp = 'Complete\_\_c';
        retObj.text = 'Name';
        retObj.start = 'Item\_Start\_Date\_\_c';
        retObj.end = 'Item\_End\_Date\_\_c';
    }
    return retObj;
}
5.4: Initialise the data:
//push the project data as overall parent object
data.push({
    id: project.Id,
    text: project.Name,
    start\_date: projectStart,
    duration: calculateDuration(projectStart, projectEnd),
    progress: project.Items\_Complete\_Percent\_\_c / 100,
    color: '#3d99da', //give it a default good looking color
    open: false //is not opened
});
//iterate over all sow-items and generate the data objects for all items
$.each(itemsModel.getRows(), function(index, item){
    ganttItem = assembleDataObject(item.Component\_Start\_Date\_\_c, item.Component\_End\_Date\_\_c, item.Project\_Component\_\_c, item.Components\_Complete\_\_c, item.Id, project.Id, item.Item\_Color\_\_c);
    if(ganttItem){
        data.push(ganttItem);
    }
});
//iterate over all sow-tasks and generate the data objects for all tasks
$.each(tasksModel.getRows(), function(index, task){
    ganttItem = assembleDataObject(task.Item\_Start\_Date\_\_c, task.Item\_End\_Date\_\_c, task.Name, task.Complete\_\_c, task.Id, task.Project\_Detail\_\_c, task.Project\_Detail\_\_r.Item\_Color\_\_c);
    if(ganttItem){
        data.push(ganttItem);
    }
});
var tasks = {
    data: data //there are some other properties on that object which I don't use (or not yet at least...)
};
5.5: Set chart properties, tooltips, templates, other styles, etc…
//convert the date to a appropriate format
gantt.config.date\_grid = '%d.%m.%Y';
//disable resize
gantt.config.drag\_resize = false;
//disable moving around the tasks
gantt.config.drag\_move = false;
//disallow dragging around tasks, only allow progress to be altered
gantt.attachEvent("onAfterTaskDrag", function(id, mode, e){
    if(mode == 'progress'){
        var sow = getSowRecordAndModel(id),
            ganttTask = gantt.getTask(id),
            comp = Math.round((ganttTask.progress \* 100)\*100) / 100;
        if(sow.comp == 'Complete\_\_c'){
            sow.model.updateRow(sow.record, {'Complete\_\_c': comp});
            sow.model.save({'callback': function(){
                updateSowModels();
                gantt.message(ganttTask.text + ': progress updated to ' + comp + '%');
            }});
            return true;
        } else {
            ganttTask.progress = sow.prog / 100;
            gantt.updateTask(id);
            gantt.message({
                type: 'error',
                text: "The Progress of SOW-Items or Dev-Projects can't be updated"
            });
            return false;
        }
    }
    return false;
});
//after edit/view details with double click save the changes
gantt.attachEvent("onLightboxSave", function(id, task, is\_new){
    var sow = getSowRecordAndModel(id), updates = {}, start = new Date(task.start\_date), end = new Date(task.end\_date);
    start.setHours(8);
    end.setHours(17);
    updates[sow.text] = task.text;
    updates[sow.start] = start;
    updates[sow.end] = end;
    sow.model.updateRow(sow.record, updates);
    sow.model.save({'callback': function(){
        gantt.message(task.text + ': changes saved');
        updateSowModels();
    }});
    return true;
});
//configure tooltip
gantt.templates.tooltip\_text = function(start, end, task){
    var startDate = new Date(start),
        endDate = new Date(end),
        sow = getSowRecordAndModel(task.id),
        noOfComps = '';
    if(sow.noOfComps){
        noOfComps = " **Number of Subtasks:**" + sow.noOfComps + "
";
    }
    endDate.setDate(endDate.getDate() - 1);
    return " **" + task.text+"**
" +
    noOfComps +
    " **Duration:**" + task.duration + " Days
" +
    " **Complete:**" + Math.round((task.progress \* 100)\*100) / 100 + "%
" +
    " **Start-Date:**" + skuid.time.formatDate('dd.mm.yy', startDate) + "
" +
    " **End-Date:**" + skuid.time.formatDate('dd.mm.yy', endDate);
};
//mark weekends with a special color
gantt.templates.scale\_cell\_class = function(date){
    if(date.getDay() === 0 || date.getDay() == 6){
        return "weekend";
    }
};
gantt.templates.task\_cell\_class = function(item,date){
    if(date.getDay() === 0 || date.getDay() == 6){
        return "weekend" ;
    }
};
5.6. (Finally) Initialise the gantt chart and set a marker on the current date:
//init the gantt chart
gantt.init("gantt\_chart");
//display the data on the chart
gantt.parse(tasks);
//gantt.scrollTo(gantt.posFromDate(new Date()), 0);
//after 250ms click on the expand icon (this is needed in order to display the data after rendering. There's a bug which prevents the data from being rendered until a DOM-change occurs...)
setTimeout(function(){
    $('.gantt\_open').click();
}, 250);
var date\_to\_str = gantt.date.date\_to\_str(gantt.config.task\_date),
    id = gantt.addMarker({start\_date: new Date(), css: "today", text: 'Today'});
setInterval(function(){
    var today = gantt.getMarker(id);
    today.start\_date = new Date();
    today.title = date\_to\_str(today.start\_date);
    gantt.updateMarker(id);
}, 60000);
If someone has more questions on how to do it (or wants the complete script) just ask me.
Cheers