Nintex Community Menu Bar

How create Custom Dashboard Reports[BAR Chart] in K2 Five

  • August 2, 2018
  • 1 reply
  • 79 views
  • Translate

Forum|alt.badge.img+6

I have created SQL table and then created service instance for that table and created smartobject and smartforms.

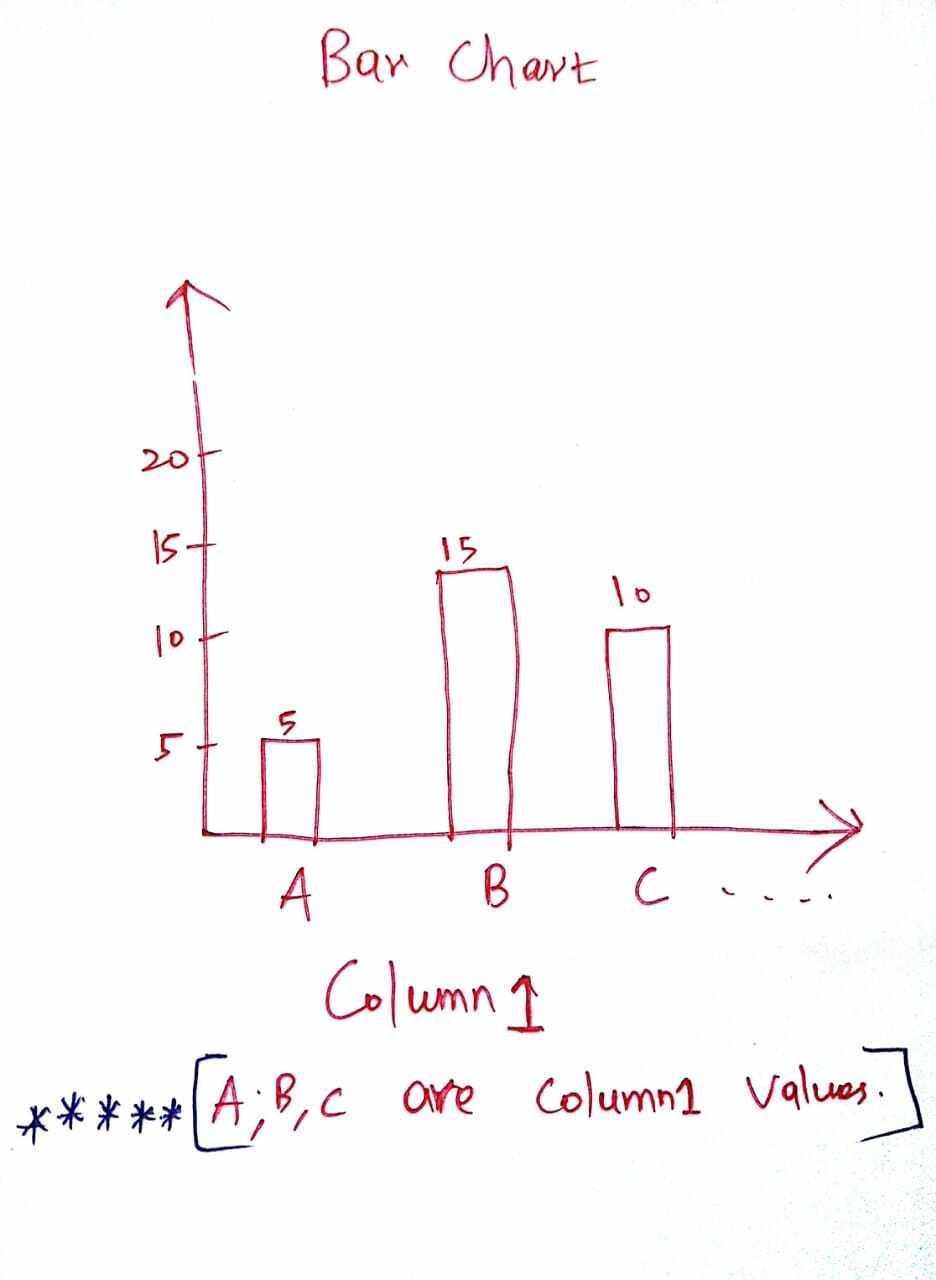
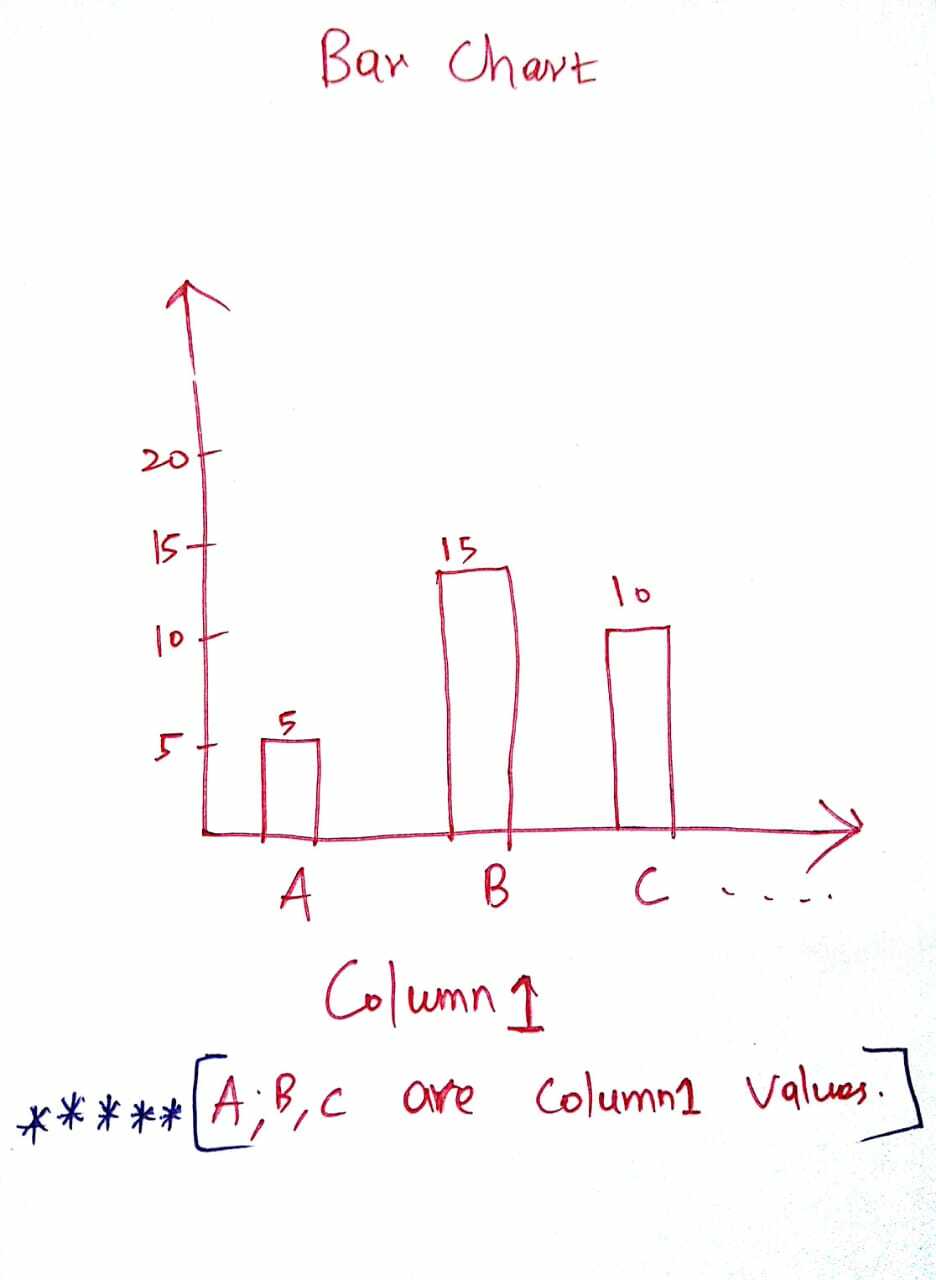
In the smartform i have a colums called "Column1".  And Column 1 having values called A , B , and C.

I want to create a Bar chart report for Column 1 counts.[X - Column 1 values , Y - Column 1 counts]
16290i9460A9F3381F0F0E.jpg


Please help how to do in K2 Five out of box way. If not possible in out of box please provide other ways.


15824i8725632B25073668.jpg

Did this topic help you find an answer to your question?

Reply


Cookie policy

We use cookies to enhance and personalize your experience. If you accept you agree to our full cookie policy. Learn more about our cookies.

 
Cookie Settings