
Page 1 / 2
Pat -
If you’re not familiar with Salesforce Governors, I’d recommend first reading up on them starting with https://developer.salesforce.com/docs/atlas.en-us.apexcode.meta/apexcode/apex_gov_limits.htm.
The intermittent nature of what you are seeing can be explained by the not to obvious fact that SFDC states that they have the “right to kill” your process if you exceed a governor. The key word is “right” - note that it doesn’t say they “will.” In short, if an execution context exceeds one of the governors, sometimes SFDC will kill your request and sometimes it won’t. There’s no docs as to when they will or when they won’t unfortunately. That said, if the load on your instance is low enough at the time of the request SFDC will likely let things run a little longer than the governor allows for. When load is higher, they will likely kill the request as soon as you exceed the limit. In short, this is more than likely why sometimes things work and sometimes they don’t.
Another possibility are due to other factors that come in to play regarding CPU usage keeping in mind that the same exact request will always vary a little bit with regards to the amount of CPU time required. It is possible that your current config is right on the border line of the max CPU and so sometimes things run a bit faster and the request succeeds while other times, things run a bit slower and the request fails.
As for why the page is taking a long time, I’d recommend using the developer console and setting up DEBUG tracing to try to determine where the request is spending the bulk of its time to start to isolate the root cause.
Still uber weird. Setup a debug log with everything turned on. A SOQL query that triggers the issue takes about 30 seconds before returning 0 rows. Copying that query into dev console has no issues and returns 0 rows immediately.
Debug log
Maybe it’s the amount of metadata being requested? What happens if you decrease the number of fields being queried? Are there any relationship and/or polymorphic fields being queried?
Nope. Removing the id parameter let’s the page load fine.
Does the metadata still load if the query produces no results? I see some of your queries have noquery behavior if the conditions aren’t satisfied.
Yup. All the models load without issue.
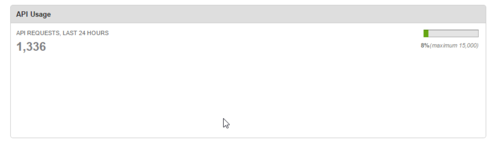
That is weird. How are you doing on API Call Usage?
HUH?
It’s far out, but skuid makes API calls to Salesforce. It’s worth checking to see if your API request limit has been reached. You can check it in the System Overview section. 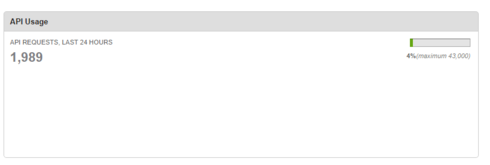
Can you post the debug log that showed the 30 second query somewhere?
Strange. I had posted something earlier with that. Here it is. apex-07L0G00004xn5ghUAA.log.xlsx - Google Sheets
I see. You do query lots of relationships going three levels deep in one of them. I think CreatedBy and LastModifedBy are polymorphic relationships since they could be groups or users. But like you said that shouldn’t be the issue since it’s working when you remove the where condition.
Some possible contributors to the issue:
- You queried in the console after you did in skuid, making the query faster the second time you ran it: http://salesforce.stackexchange.com/questions/25334/why-is-my-soql-query-slow-the-first-time-faster-…
- Visualforce remoting runs queries differently than the console does http://stackoverflow.com/questions/14838416/same-soql-query-taking-a-long-time-in-a-vf-page-controll…
Pat~
Wanted to check in and see if you’re still having this issue.
Thanks!
Karen
Yes. It is still an issue. Very very odd behaviour.
na43 has been having issues since a couple of days prior to new years (they only admitted it as of today on trust). We encountered the same thing. They probably start cracking down on CPU limits when their instance starts barfing. Considering cpu time is cumulative of apex code, workflows, managed packages etc… this can be one of the biggest pita’s to track down as tools / logging leave a lot to be desired on this platform.
Hey Pat -
If NA43 is/was having issues, then all bets are off of course. According to trust, NA43 is green - take that for what it’s worth though especially given what Rick had to share about apparent issues late last year that weren’t acknowledged until today.
Assuming you still have issues on this next time you try, let us know the following:
1) How many records are in the object involved in the query?
2) Are you using client side model or server side model?
3) If you remove the Line_Number__c part of the where clause what happens?
4) Do you have a sandbox that you can test this in? If yes, how many records in that object and what are result of the page?
5) Was this page working previously and all of a sudden started experiencing this issue without any configuration changes? Or is this a new page? Or did the page change recently and then the issue start?
Yup. The page has since started to perform significantly better. Not 100%,but high nineties. Super annoying since I spent something like 5 hours on the issue. ERG! Wasn’t a complete loss as I found a few small issues that needed addressing and brushed up on my debug log skills.
That’s great!. If you click on the orange section you’ll see the history which sort of coincides. https://status.salesforce.com/status/…. (you may have to page back a day) I had an office of 20 lawyers that was sent home due to this. So there is friendship in misery my friend.  Beware that most likely you will not encounter this issue in a sandbox, probably not even a full sandbox if your lucky enough to have one ($$$)… since they are not as harsh on killing processes that violate the 10k milli cpu limit since sandbox hardware is not as powerful. The only true way is to prepare ahead of time is via sifting through the logs (grrr) and make sure the processes are well under the limit.
That’s the oddest part of it. The “offending” query ran in dev. console in less than a second but was timing out in the debug logs.
Yep. It’s sort of a rough one… Somewhat non-related… Note. SOQL does NOT count towards these limits. It’s more any looping to build the soql / and processing of soql results in a loop. and any line of managed packaged code / workflow / process / flow…etc that runs in the same transaction… DeveloperForce
Hmmm … so that suggests that it wasn’t the queries but something else to do with the page? Stranger still, because I had stripped the page down to just 4 models without components, js, css. The page was being used in via preview, so no page overrides. No custom vf, apex, flows or process builders on the objects. One workflow, but it wouldn’t run unless the specified change happened. It was as if the object being queried didn’t like being queried via Skuid. That to me suggests the version of the API, if different from dev. console, was the issue.
I’m not really at all familiar with SKUID to be honest… more of an SFDC guy. I’m assuming it’s some managed package installed on the SFDC instance that takes this xml and builds queries / results behind the scenes.
Yup. Spot on. The queries being built were asking for a record each and approx. 25-50 fields each. So really not something for SF to trip up on.
I encountered the cpu limit on various queries that returned only 1 row as well. For us. it wasn’t so much the nbr of rows returned but rather the looping that was building the soql as we were doing describe calls and then evaluating each field deciding whether or not to put it in the SOQL string.
Reply
Enter your E-mail address. We'll send you an e-mail with instructions to reset your password.