Here’s a quick overview of how you can use linear and non-linear regression on your Skuid charts.
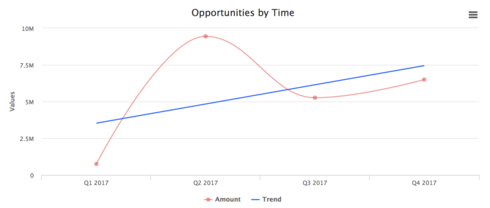
In my example, I’m using linear regression to plot the trend of opportunity amounts over time. The output of my chart is below:
Here’s how my example works:
-
My chart has CloseDate in the X axis and one series on the Y axis (sum of the Amount). I have rolled the close dates on the X axis up to Calendar Quarters. I choose Spline as the chart type.
-
I created an external JS snippet pointing to the Highcharts regression resource at https://rawgit.com/phpepe/highcharts-regression/master/highcharts-regression.js
-
I created an in-line JS snippet with the following script. You can change the series names and colours as appropriate. You will need to reference this in-line snippet on the chart so give it a suitable name.
var chartObj = arguments[0],
$ = skuid.$;
//grab the values from the series in the chart
var datavals1 = chartObj.series[0].data;
//declare a new array for the new series to use
var datavals2 = [];
//for each value in the original series grab the position and data values
//push these into a new array **
for (var i = 0; i < datavals1.length; i++){
** datavals2.push([i, datavals1[i].y]);
}
//create a new series, with linear settings, use the datavals2 array as the data source
//in this case use linear regression
var newSeries = {
regression: true ,
regressionSettings: {
** type: ‘linear’,**
color: ‘rgba(40, 100, 255, .9)’,
name: “Trend”
** },**
** name: ‘Amount’,**
** color: ‘rgba(223, 83, 83, .5)’,**
** data: datavals2**
}
//overwrite the first series in the chart
chartObj.series[0] = newSeries;
- The last thing is to then apply the in-line snippet as the Before Render Snippet on the chart (Advanced properties tab)
Hopefully this is useful to people and provides a template to work with to build regression on your own charts.
You can find more about Highcharts regression here. There are some other examples and regression types that Highcharts supports (polynomial, logarithmic, exponential and loess).


