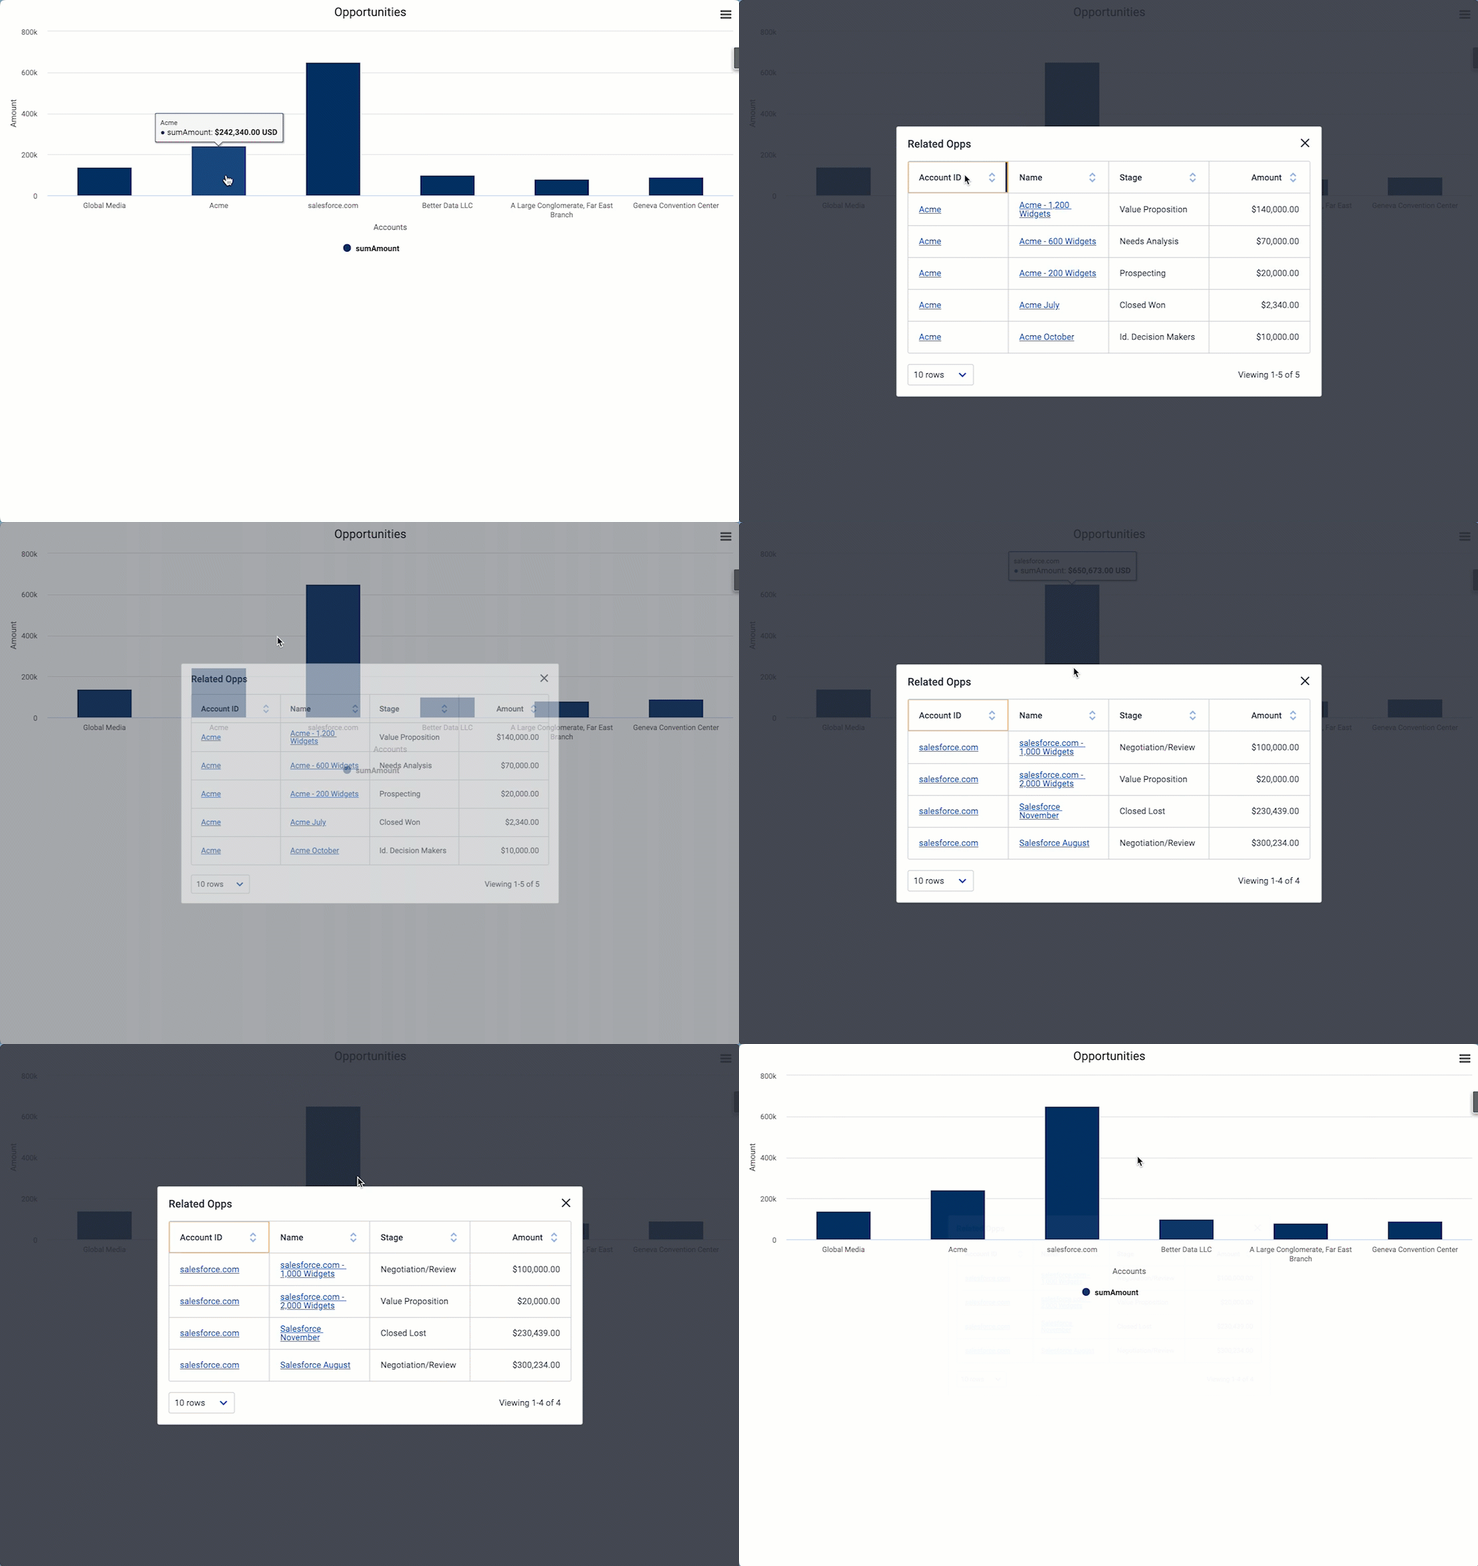
Quick post today - got an ask to create a chart on an aggregate model that opens a detail view when you click on a series. This is a typical use case for Skuid but a little tricky to set up the first time.

-
Details model with filterable condition. Create a details model. This is a basic model on the same object with a filterable condition on the field that you’re using as your chart series (this should be a grouping field on the aggregate model). In this example we have a chart showing opportunity value grouped by Account, so AccountId is the field we’ll use to link the 2 models.
-
Chart series action to filter details model. In your chart series actions, activate and set the value of the this condition on your details model to the field from the aggregate model. - set value to
{{accountId}}
*Ensure you’re using the correct field alias from the aggregate model. You can verify in that model’s field list. -
Actions to query model and open modal. Then add actions to query the details model (get more) and open a popup modal.
-
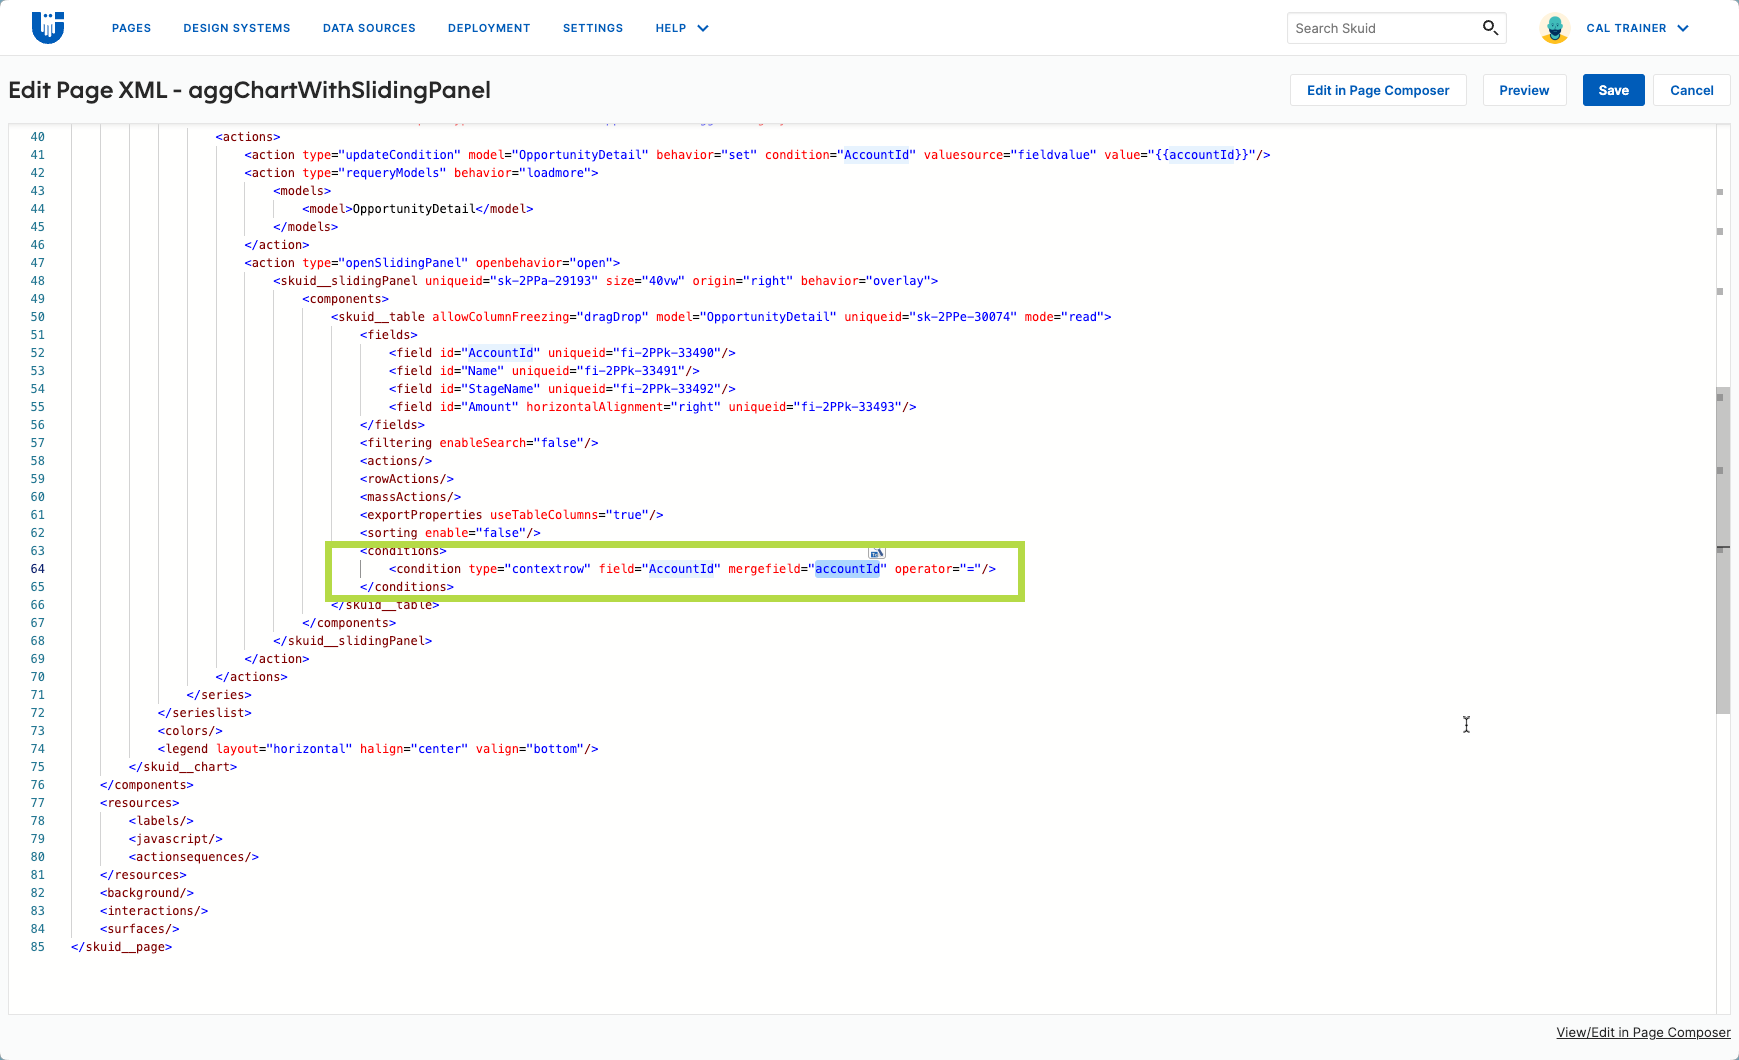
Context condition in the modal. Add a table (or list) on the details model to your popup/modal. Add a context condition where AccountId = AccountId - note that this field name doesn’t match the field name from the aggregate model, so we need to fix it in the XML

Save your Skuid page and click “view/edit XML in the bottom”. Search the XML for and update that context condition so the mergefield proeprty is the field alias from your aggregate model, e.g.{{accountId}}
Hope this is helpful!
If your chart is on a basic (not an aggregate) model, then you can just use the field picker and the normal field name e.g. AccountId and you don’t need to go into the XML to update the context condition.
Related Resources
Skuid Skool
- Import Prebuilt Skuid Pages
- Give Users What They Need: Drawers, Modals, and Console Views - Level 2
- Get Started with Data Visualizations - Level 2
Docs

