
First of all, charts are awesome! Thanks for all the hard work. I know they’re still in their infancy, so not sure if these features are available yet…

Is there a way to modify the formats of any of the numbers displayed on a chart?

I’d like to show data axes values as percents, and truncate values calculated by an aggregate operation.

eedb758816902ff7b21c7428bc249518330c4bec.png

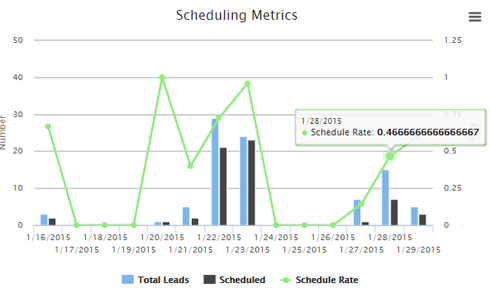
As an example, it would be awesome if this schedule rate could be displayed as “47%”

Matt,


While this is an old question…thought I would reply. Here is a snippet that changes the display to percentage. You’ll need to adjust the part that references the chart type. After you save the snippet, reference it in the ‘Before Render Snippet’ under the ‘Advanced’ tab of the chart component. Check out the Highcharts API reference for more http://api.highcharts.com/highcharts


var params = arguments 0],
$ = skuid.$;
params.plotOptions.pie.dataLabels = {
enabled: true,
format: '<b>{point.name}</b>: {point.percentage:.0f} %',
style: {
color: (Highcharts.theme &amp;&amp; Highcharts.theme.contrastTextColor) || 'black'}
};

Thanks Bill.  Appreciate your contribution here. 


Bill,


Thanks for the reply.


Here’s what I’ve been using;


var chartObj = argumentse0], $ = skuid.$; var newTooltip = { valueDecimals: 2, pointFormatter: function(){ return this.series.name + ': <b>' + (this.y * 100).toFixed() + '</b>%'; } }; var newLabels = { formatter: function(){ return (this.value * 100).toFixed()+'%'; } }; chartObj.seriesr2].tooltip = newTooltip; chartObj.yAxisA1].labels = newLabels;

It works great for the labels, and valueDecimals is working, but the pointFormatter doesn’t work. Not sure why. It works fine when I test in the highsharts jsFiddle.


This is really great! Do any of you have code to render a count label in the pie chart as the actual number rather than the word “count”. This value can be found when you click on a piece of the pie, yet I want it to show without needing to point and click.


Anna,

This is just off the top of my head, so I could be remembering incorrectly, but I think if you change the split type of the pie series to Template instead of Field, and use {{MyField}} as your template, you should get what you want…

Although, I may be remembering doing that in a basic model, not an Aggregate. 

Perhaps that helps?

If you can’t do it in skuid directly, you should definitely be able to do it by looking through the highcharts api.


Trying to digest your response as I am fairly new at all of this…

To get the “count” what field would I use in {{MyField}}? It would have to be an aggregate model to get the count of all of the pie segments, correct?

I looked at highcharts api, yet my learning curve is still a bit steep so I struggled to find it. 

Rob Hatch had posted this snippet to show percentages, yet I need the count and I was not sure how to edit it:

var chartObj = argumentsg0],


$ = skuid.$;<br><br> $.extend(true, chartObj.plotOptions,{<br> pie: {<br> dataLabels: {<br> enabled: true,<br> formatter: function () {<br> return this.point.name + ' ' + this.percentage.toFixed(2) + '%';<br> }<br> }<br> }<br> });<br><br> $.extend(chartObj,{<br> tooltip: {<br> enabled:false<br> } <br> }); _______________ I think this "<i>return this.point.name + ' ' + this.percentage.toFixed(2) + '%'"</i> need to be edited, yet I could not figure out what edits I needed to make to return the field name, plus the count total. Thanks for your help!

You were on the right track.  The HighCharts API documentation is very extensive and sometimes difficult to wade through.  The correct syntax is as follows:

                    return this.point.name + ’ ’ + this.y;

It’s not exactly intuitive that the value of a pie chart is actually is y axis…  But that’s what it is… 


Ah, ha! Getting so much closer. Thank you! Now, what do I need to do to take the word “count” out.


var chartObj = arguments[0],
$ = skuid.$;

$.extend(true, chartObj.plotOptions,{

        pie: {

            dataLabels: {

                enabled: true,

                formatter: function () {

                    return this.point.name + ‘’ + this.y;

                   }

            }

        }

});


$.extend(chartObj,{

    tooltip: {

        enabled:false

    }    

});


This is pretty easy. In your series definition - look for “Split Type” set this to “Template” and choose the field you are counting. This will remove the “Count” label.