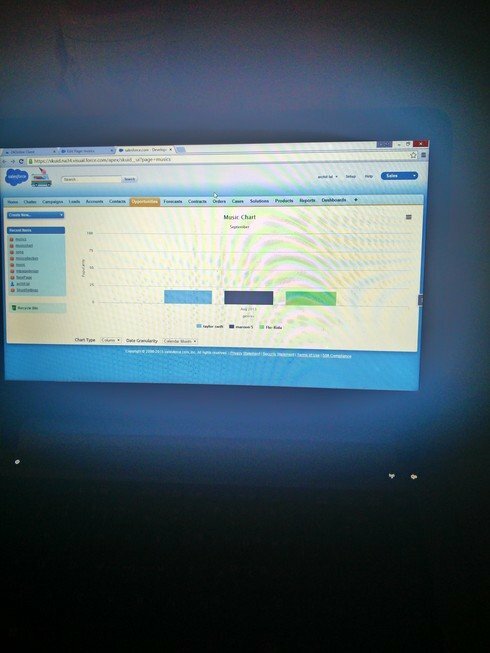
while i was working on the charts, the only problem i was having is giving each of the element different values. for example if i have three elements named “bob,ryan and ron” each of them have value 20. how do i give them different values?
Archit,
Can you provide a bit more detail? How are you assigning values? And to what kind of element?
You just have to change the data in the model that the table is running on.
For example, you could put a table on the same model below the chart. When you update the data in the table, the chart will update dynamically.
My guess is that your series is simply returning the count of records that match the names, rather than the sum of values.
And Matt is right - what is your underlying data?
The underlying data I tried using table but it’s no use… It’s still not showing the values I want it to show. If possible could you show me how to create the chart with designated records
If your data won’t show in a table, it won’t show in a chart. Get your data right.
Then follow the chart tutorials: http://help.skuidify.com/m/supercharge-your-ui/l/293051-visualizations-charts-and-graphs
I did try that… But the result wasn’t the same… It came a bit different
Enter your E-mail address. We'll send you an e-mail with instructions to reset your password.

