I’m attempting to modify my charts to export the SUM of the slice when exporting.
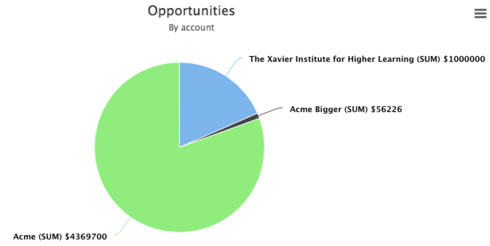
I have a pie chart that shows the various products a customer has purchased. I have a series that sums the revenue and then splits it up by name.
This is great for when the user is viewing the chart in skuid, but when they export it, the SUM values are not displayed since it ONLY displays on mouse over.
I attempted to modify the code from this post:
https://community.skuid.com/t/show-percentage-lables-in-charts
I can’t seem to figure out how to display the split. I can get it to display the total for the series but not by slice.
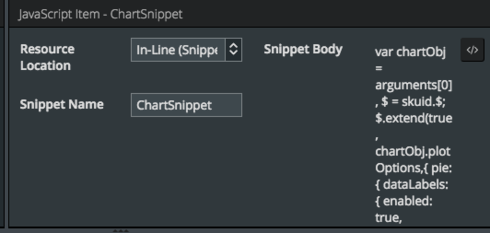
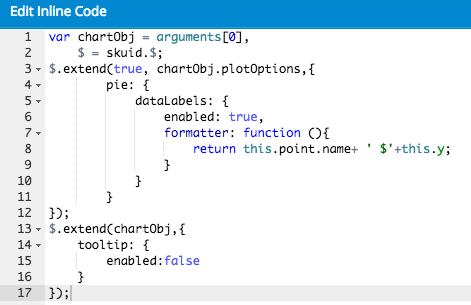
How do I modify the following JS snippet to display the sums of the individual slices and not the sum of all slices?
var chartObj = argumentsg0],<br /> $ = skuid.$; $.extend(true, chartObj.plotOptions,{ pie: { dataLabels: { enabled: true, formatter: function () { return this.point.name + ' ' + this.point.total; } } } }); $.extend(chartObj,{ tooltip: { enabled:false } });


