I have created SQL table and then created service instance for that table and created smartobject and smartforms.
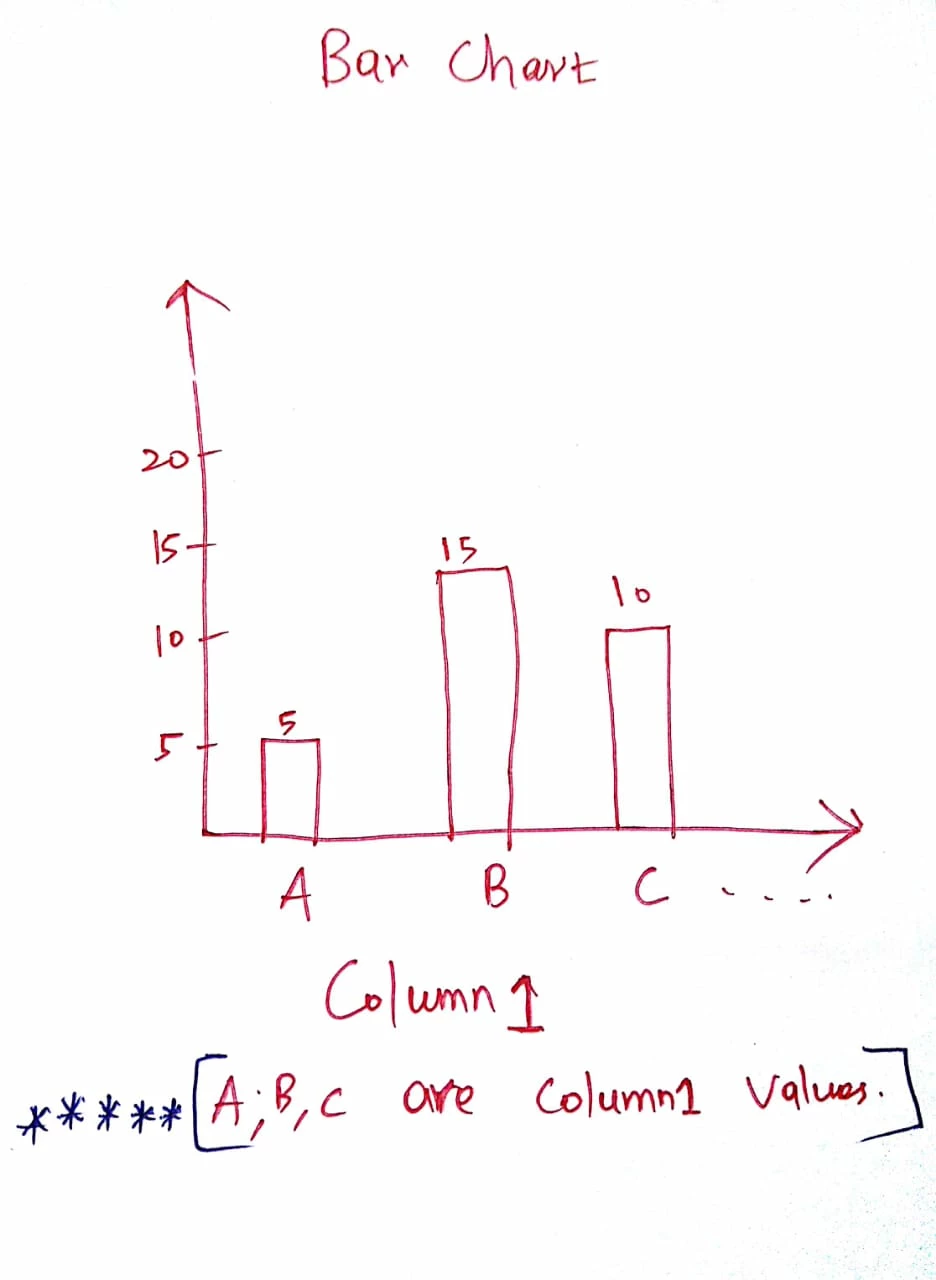
In the smartform i have a colums called "Column1". And Column 1 having values called A , B , and C.
I want to create a Bar chart report for Column 1 counts.[X - Column 1 values , Y - Column 1 counts]
Please help how to do in K2 Five out of box way. If not possible in out of box please provide other ways.
Best answer by K2Steve
Hi
To create a bar chart based on data stored in SQL you can do the following in a list view.
Prerequisite:
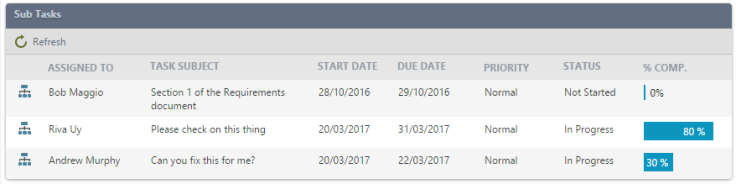
You need to store the “Percentage Completed” data somewhere and manage the value somewhere. In my case, I have a SmartObject with a column “Task Percentage Completed” number. Whenever I assign a task to someone, the person can manually update the progress value to a number. Optionally, you could also automate the calculation of the completed value within your workflow.
UI Steps:
1. Add a Data Label into your page. In my case, I’m using a ListView. I added it as a new column. Set the Data Label as aLiteral.
To create a bar chart based on data stored in SQL you can do the following in a list view.
Prerequisite:
You need to store the “Percentage Completed” data somewhere and manage the value somewhere. In my case, I have a SmartObject with a column “Task Percentage Completed” number. Whenever I assign a task to someone, the person can manually update the progress value to a number. Optionally, you could also automate the calculation of the completed value within your workflow.
UI Steps:
1. Add a Data Label into your page. In my case, I’m using a ListView. I added it as a new column. Set the Data Label as aLiteral.