I have created a form which will then generate a document later in the process.

Within the document (a customer report) I would like to include graphs which represent the data the customer input into the form at the beginning. I have tried the standard insert graph in word (in my case a pie chart) and used the document tagger to input the field information from the form into the excel data for the graph in word but it doesn't work. 
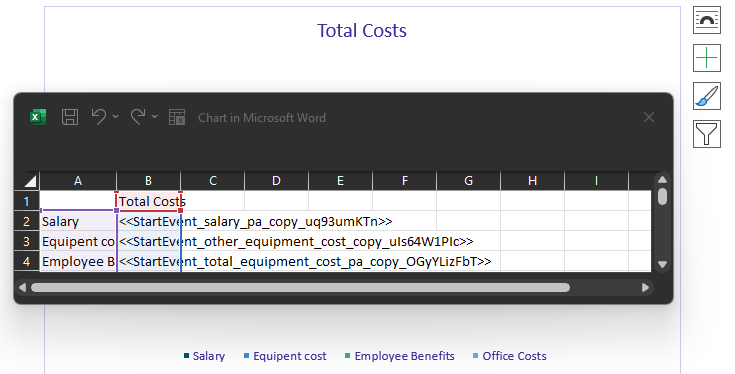
Does anyone have any ideas please?

Hi @Andy.Emery 

Have you considered using Excel spreadsheet instead of MS Word docs as the source template?


Create Excel template.
Create the hvariable] placeholder.
Fill up the cell with the hvariable] values using the Document Tagger. (Note: The Tagger works a bit different for Excel, just refer to the Help)
Create your graph(s) - Initially use some temp values to get your graph formatted, later remove those value. The final values should be populated by the DocGen 


Hope that helps 


Hi @Garrett 

Unfortunately that wont work as 98% of the document is writing and images and written lie a report.  I would just like to show 1 or 2 pie chats representing the information.  If its not possible could we do a feature request?


@Andy.Emery 

You could combine multiple template to generate the final PDF.

Page 1-9: Template Source is DOC
Page 10: Template Source is XLS

Pages 1-9 are from the Word Doc and the final page is the graph. 


If you wanted to sandwich the graph between DOC, you will need to break up your main Word Doc into smaller parts.

Page 1-5: Template Source is DOC #1
Page 6: Template Source is XLS #1
Page 7-9: Template Source is DOC #2
Page 10: Template Source is XLS #2


Hi @Garrett  Thats a workaround but not very slick at all.  I would have to adjust the layout, formatting of the excel to look exactly like another page of the report while keeping page numbers aligned across 2 documents.


For a professional looking report this just is not feasible.  Is there a way to add a feature request?


Reply