Everyone has a different data model in Salesforce. But there are common elements to every use case no matter how complicated. You have Objects, Fields & Reports. This means when you want to create dynamic documents out of Salesforce data you need to dynamically replicate it on the page. Sometimes there are 3 records sometimes there are 40 Related. Either way the methods are the same to reach the data.
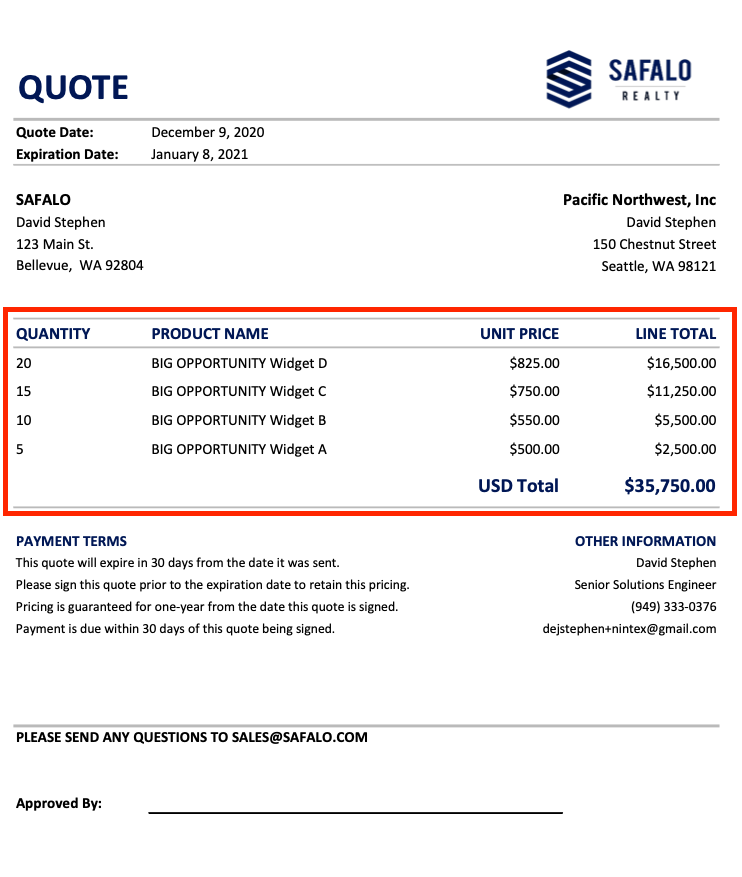
There are five main ways to replicate data with Drawloop Dynamic Document Generation…
- Row
- Table
- Grouped
- Section
- Hierarchy
Documentation for reference: https://help.nintex.com/en-US/docgensf/Templates/Replication.htm
*In this article I am going to focus on the two most common ways… Row & Table.
Row Replication
“I have an Opportunity and want to display the related products in a table.”
This is a common quote to cash use case. Swap out the objects for custom ones and the use case changes. What doesn’t change is the calorie burn to set this up. "I have data related with a one to many relationship to other data and want it in a table." Now I can make this a completely different use case but the setup remains the same.
*Drawloop connects to any data model - custom objects too. Drawloop sees everything as objects and fields.
To have Drawloop reach the data you first have to create a relationship to reach the data. Opportunity to products for example.
**In some cases with standard vanilla Salesforce objects.. relationships are automatically setup for you.
Helpful blog on field tagger and relationships: https://community.nintex.com/t5/Community-Blogs/Drawloop-Field-Tagger-Basics-Tips-Tricks-amp-Relationships/ba-p/95440
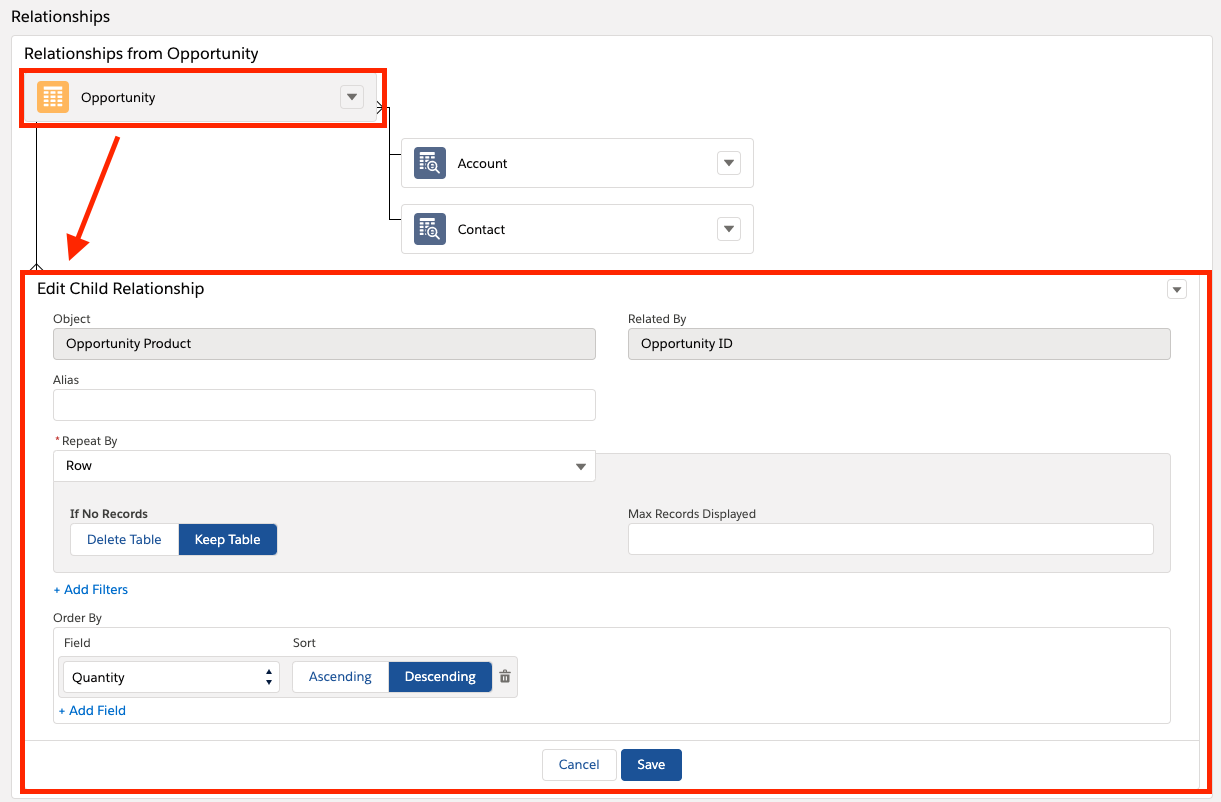
The setup above is the basics… Establish what you have and what you want. Once you do this the field tagger will give you the tags you need to place in the template. Remember the "start tag"… found at the bottom of the tagger (in reference to the “helpful blog”)… will be needed for any replication.
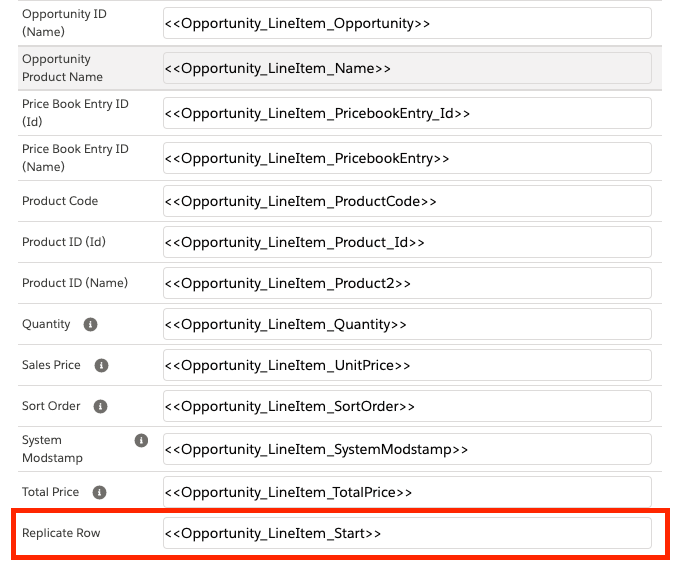
Typically in this format…
Word & Powerpoint:
<<Object_Start>>
Excel:
Object_Start
Common Issue Alert:
***REPLICATION HAPPENS IN TABLES NOT OUTSIDE OF THEM.
All tags must be inside a table for replication to function. (Word & PowerPoint)
Table Replication (Word & PowerPoint)
Lets add to the example above. I have an Account with Opportunities related. Under each Opportunity are the same Products mentioned above. How do I get all the data to show in a pleasant way in the document.
Like before first setup the relationships.
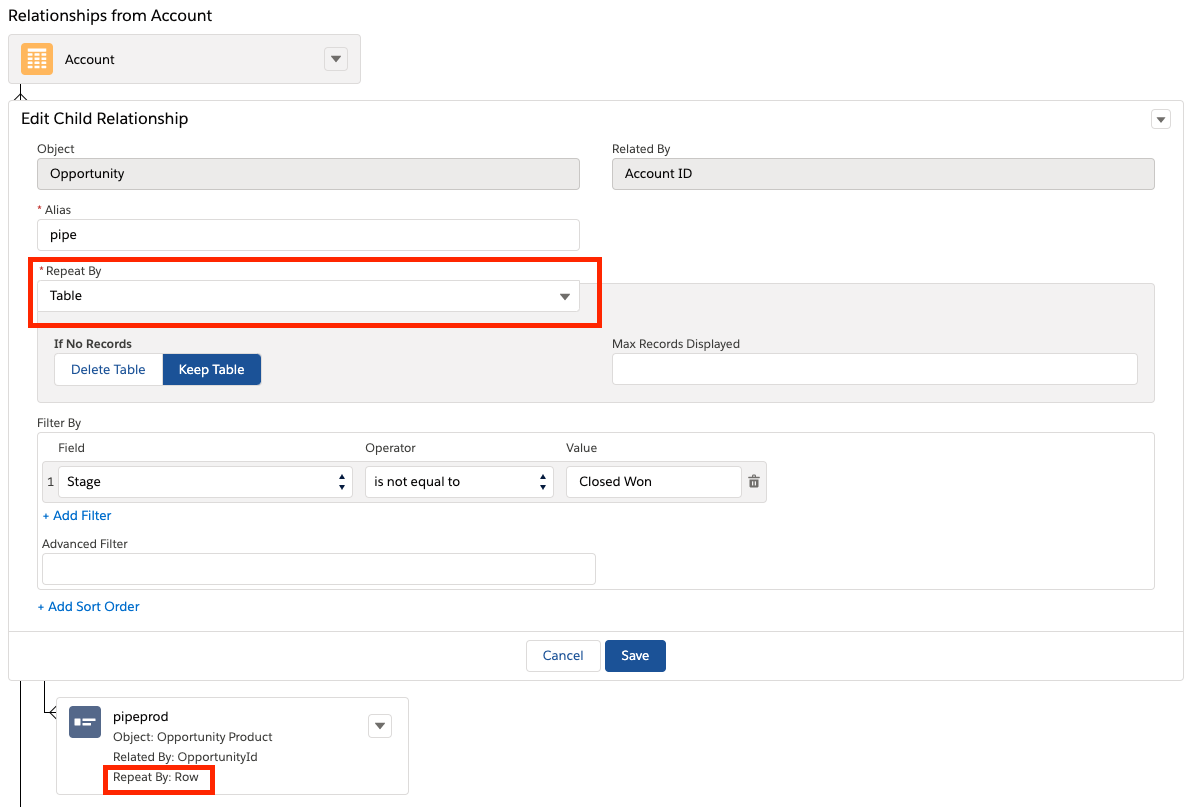
Notice I have table and then row type. This will allow the creating of lets say an account plan summary type document. Make sure for the table replication you grab the Table Tag from the field tagger.
**The tagger will display a row start or table start tag based on what the relationships “repeat by”” value is.

Next make sure you add the tags correctly to the table.
Great Reference For Adding Tags: https://help.nintex.com/en-US/docgensf/Templates/TableSlideReplication.htm
Keep in mind how the tags will render on Word vs PowerPoint. Word will simply replicate the tables going down the document. PowerPoint will create a new slide for each table replication record related.
One more thing…
Alias Relationships
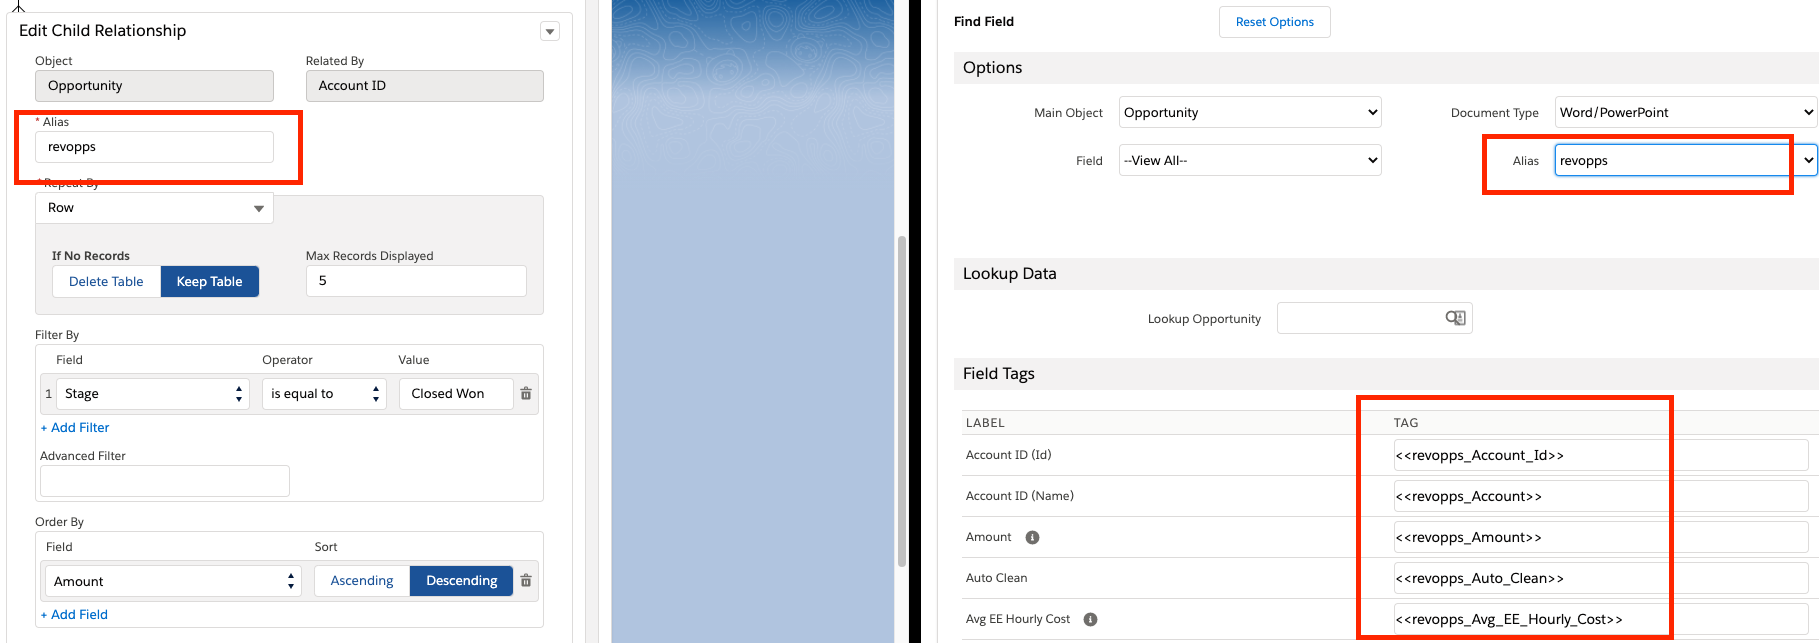
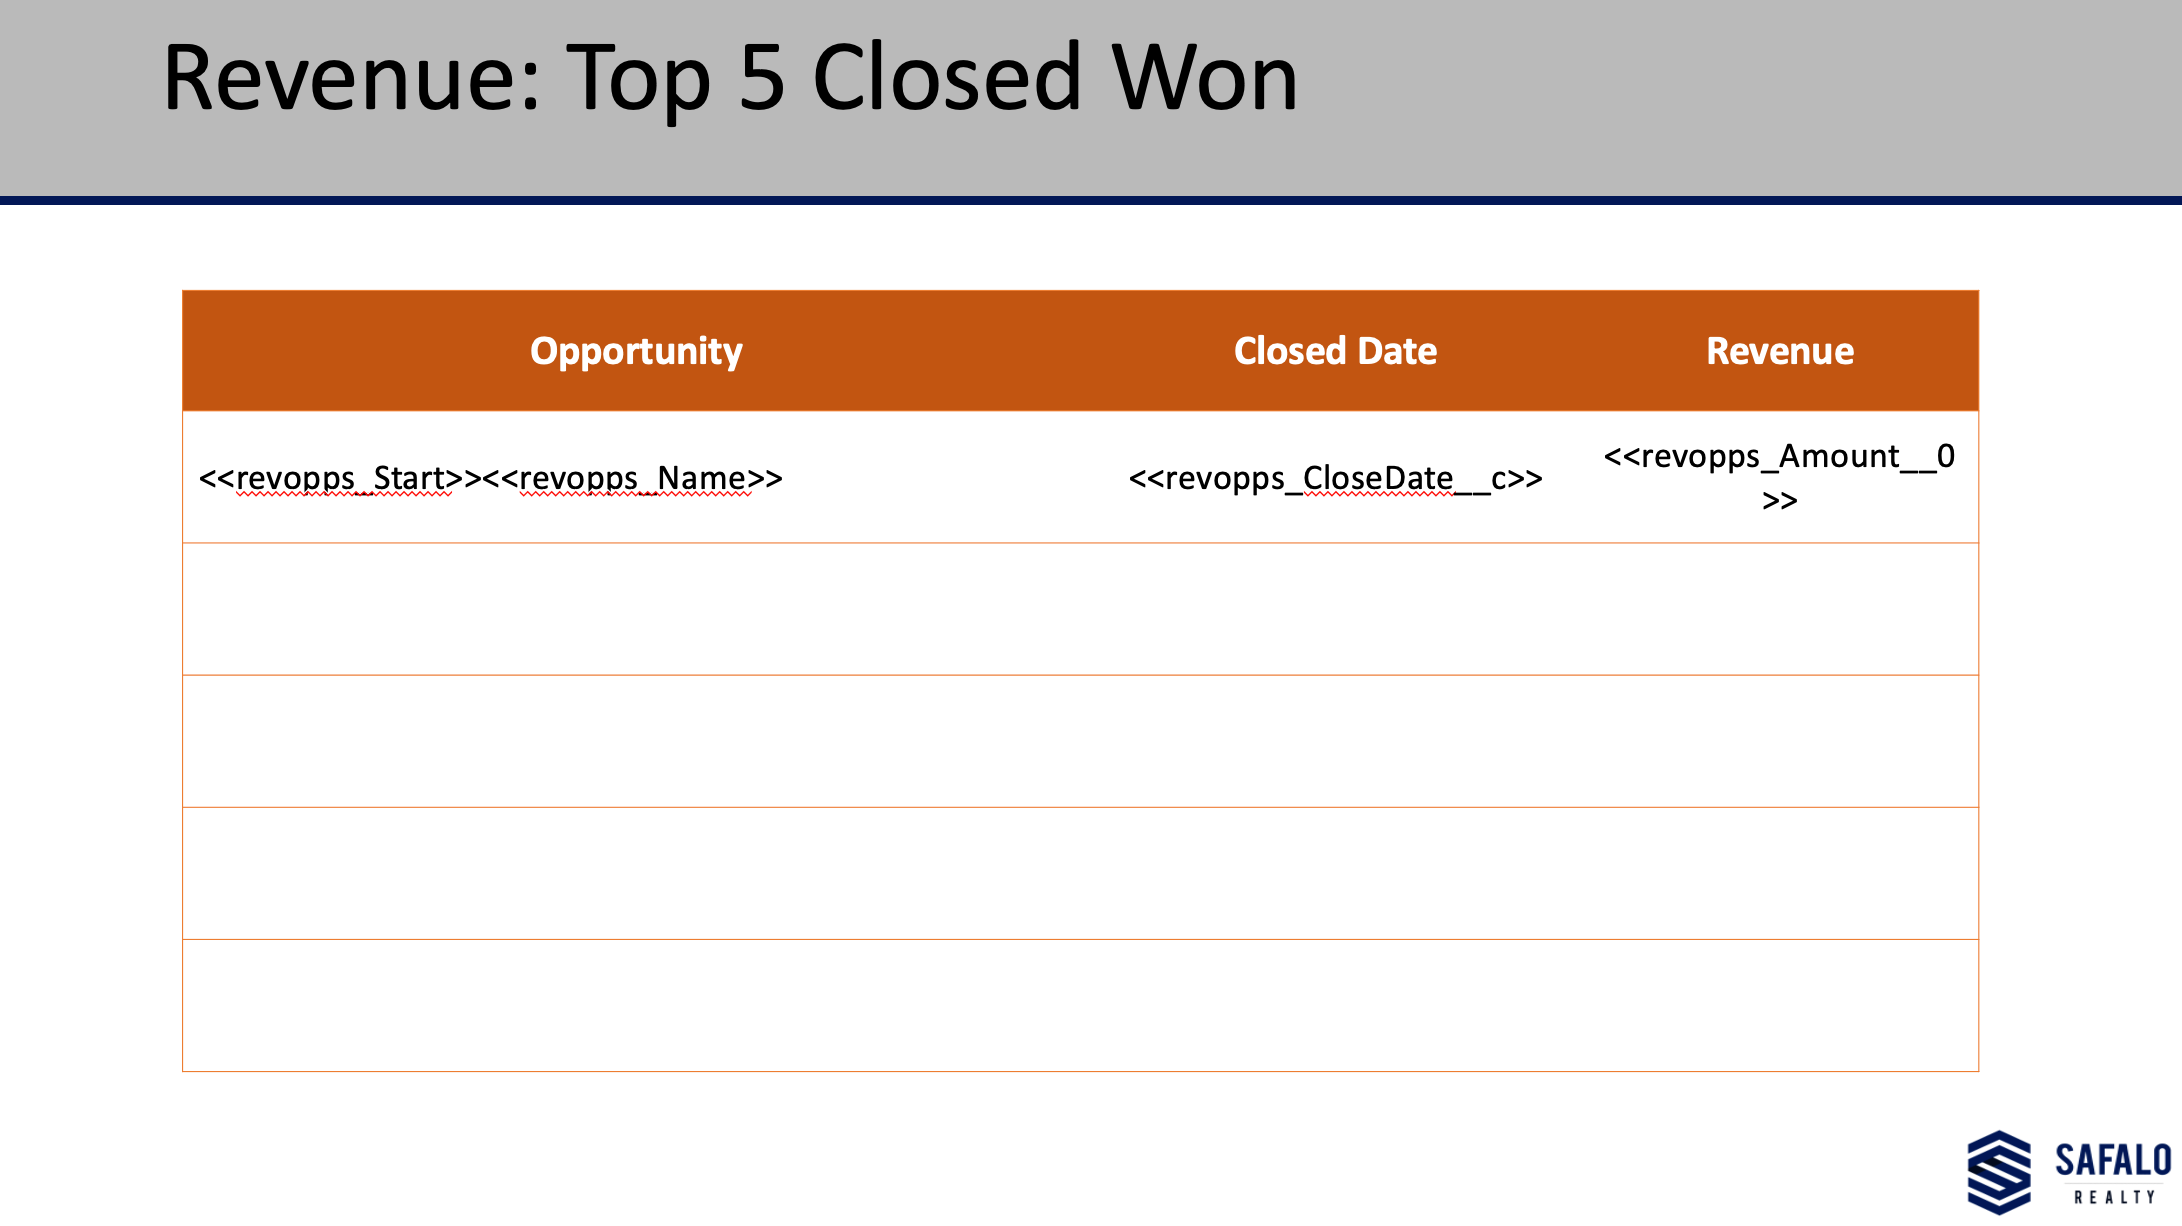
What if you have two tables of opportunity data. One for the top five deals in a specific stage. And another table that is grabbing deals in another stage. When you use an alias (setup in the picture below as “revopps” for example) the field tagger will give you the ability to use those values in the document.
With these basics this should give you a lot of freedom in which you display your data. Feel free to reach out if you have questions.
Thanks For Reading!
Dave
