We built Loan App, Financial App, Fund App, and HR App all on Skuid for Salesforce. And they all work brilliantly because of Skuid through mostly no coding methods, BUT in our Financial App and Fund App we have found that Skuid tables lack the ability to manage financial data because it does not allow - in one table only - the ability to display detail rows by group, display the subtotal of that group, and then break and repeat for all of the different groups in the data.
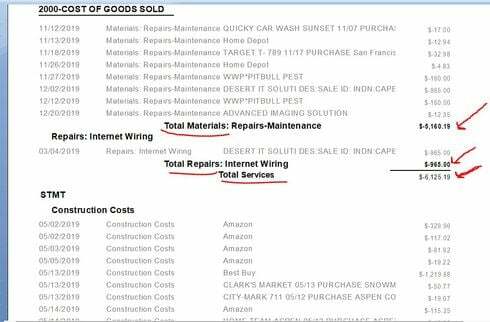
For example, I am looking at hundreds of financial transactions, and they are categorized by GL Account Number, or TaxLine, etc. Let’s say I want to see - in only one table - all of the May transactions from my bank account and I want to see all of the Deposits first, subtotal, break with section header and then start the next section called Expenses, subtotal, break with section header and do this over and over for each break on the TaxLine__c field. A solution I found on this forum was to use filters and I am doing that, but that doesn’t work in financial reporting, because you have to be able to see ALL of the data on the screen at the same time in order to balance or reconcile. All accounting software and Excel and old school financial software allows you to display an entire list of transactions and break at the next category and give a subtotal. I have scoured the internet and the skuid forums searching for a possible solution, and I found nothing that would help.
However, during my search I did discover Crystal Reports, which is another miracle software like Skuid, and after a bit of formatting, I can print very nice reports from my Salesforce data that are super complex with as many subtotals and breaks that I want.
So, of course I wanted to see the data like this in my Skuid pages, so I tried to figure out how to access Crystal Reports from Skuid in real time so I could see all of my groupings and subtotals, but can’t figure that out either.
So, if there is anyone out there in the Skuid world that has a way that I can accomplish this, can you assist? Maybe we could use a javascript snippet where i can pass parameters (date range, company name, report type, etc.) and it could group, print, subtotal, break and repeat, but I cannot write javascript. This is becoming urgent as I cannot balance any of our Funds or trust accounts or financial transactions without having to look at numerous tables, write down the subtotals on paper, and go to the next grouping.
PS: I do have aggregate models, but those do not have the detail transactions underneath the total line, therefore, you cannot tell if anything is miscoded using aggregate models. If I could accomplish this in some manner, then this would solve it, but it isn’t possible for all of the drawers to open on every subtotal line, right? Once Skuid allows this “grouping, print, subtotal, break” action and once Skuid has a “print function” built in, I will be the happiest no-coder Skuid user on the planet.

