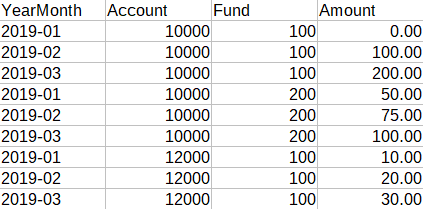
I have an aggregate query that returns a field called “YearMonth” in the format “YYYY-MM”. I also have several other fields with data in them; one of the fields is “Amount”.
I would like to create a table where each distinct value of YearMonth is its own column in the table, and each cell in the YearMonth column is filled in with the Amount for the combination of that YearMonth and all other columns in the table that aren’t YearMonth columns.
For Example
Column Header: Account,Fund,2019-01,2019-02,2019-03
First Row: 10000, 100, $0, $100, $200
Second Row: 10000,200,$50,$75,$100
Third Row: 12000,100,$10,$20,$30
etc.
Is this possible? How might I go about constructing a table that looks like this?
For reference, in the example above the data formatted as it was originally returned by the query is here:
But we want to take distinct values from the rows in the YearMonth column and turn those each into columns and under those columns show the Amount value for the combination of that YearMonth value and the other columns in the sheet; making the table look like this:
Mark,
The only way that I have done this is using Model Lookup fields and separate models for each column. You have a ‘base’ model that aggregates data by Account, Fund. Then separate models to aggregate the Sum the amount by Account, Fund, and Month. You then use your YearMonth field as a lookup between models.
In the skuid-labs GitHub, there is an ‘Aggregate Formula Function’ that you can use. It will roll up data from your model. You may be able to use this to create each of your Year-Month column roll ups.
https://github.com/skuid/skuid-labs/tree/master/experiments/formulaFunctions/aggregation
If you don’t need Skuid, you may be able to do this with Salesforce Reporting.
Thanks,
Bill
Reply
Enter your E-mail address. We'll send you an e-mail with instructions to reset your password.
