Charts and Graphical Visualization

  • 21 November 2018
  • 4 replies
  • 33 views

Has anyone had any luck working with JS Charting tools on K2?

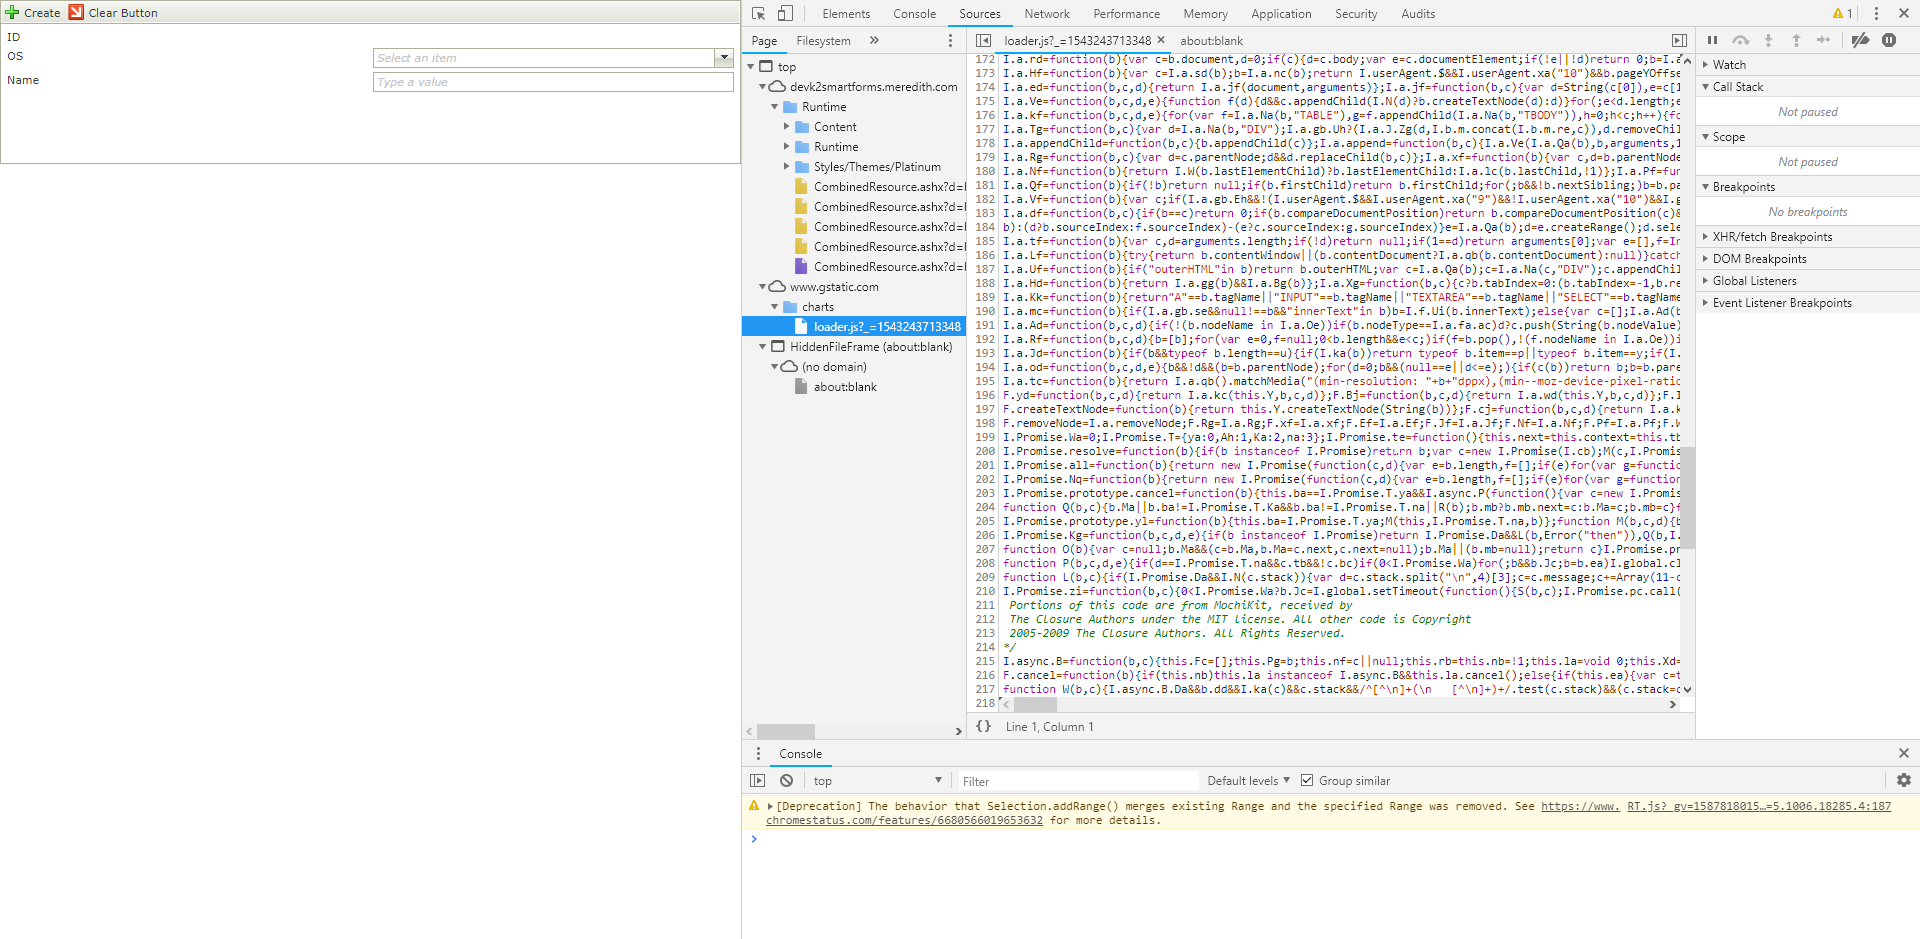
I have tested a couple of times with Charts.js and most recently with D3.js(https://d3js.org), and it seems like K2 never renders that stuff. I wonder if it's because it calls on a js library hosted somewhere on the internet and it blocks that or something?

I just want something to do pie charts and graphs without resorting to PowerBI which would cost so much money.


4 replies

Badge +15

This is tricky. I am not sure if you can import another javascript library. Did you check your browser's console if there are any js errors being reported?

After a bit of looking at the developer console, it does look like it manages to import the JS Library from google (I was testing the test pie chart from google located here: https://developers.google.com/chart/interactive/docs/quick_start) 

I have also attached a screenshot showing it in the dev console.
I do not know what prevents it from showing.


Or do you refer as in, even if it pulls it, it might not use it?
Could I as an alternative include the content of the script in an expression?

For the record, I did try adding the contents of the JS library to the header within a <script> segment, which worked on a standalone html file(meaning it wasnt referencing an external library, instead using included code). But when placed in a data label in K2 it still did not work... I do not understand why... 

Reply