Nintex Community Menu Bar

Charts are awesome.  You can even export them to put in your powerpoint slides to impress management.  COOL. 

However the default charts only show the numbers associated with the chart section when you mouseover it.  You can’t mouseover the picture in your powerpoint slide.  Management can see that the slice is really 45%.  BOO.  

Can we add numbers to the chart lables so they show all the time and get included in downloaded pictures?  

I’m glad you asked!


This sort of formatting details is where the Highcharts API provides pretty complete flexibility for customizing chart output. You get to this customization by adding a “before render snippet”. Here is how.


**1. Create a javascript resource of type “inLine Snippet” **

Give the snippet a name you will remember. I used chartPercentages.


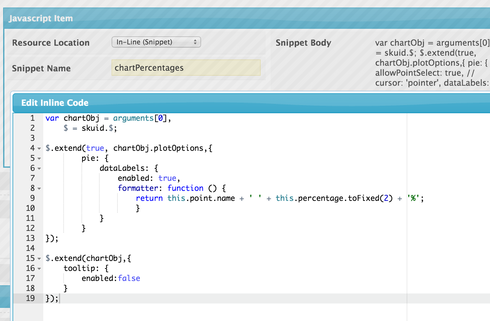
Here is the code I used in the snippet.


var chartObj = arguments 0], $ = skuid.$; $.extend(true, chartObj.plotOptions,{ pie: { dataLabels: { enabled: true, formatter: function () { return this.point.name + ' ' + this.percentage.toFixed(2) + '%'; } } } }); $.extend(chartObj,{ tooltip: { enabled:false } });

What this code does is add a custom dataLabel formatter to my pie chart that shows point name and point percentage. The second section of the code removes the hover feature from the chart. The data now shows all the time.


2. Change the chart properties.


Look for the advanced tab and the “Before Render Snippet” property. Add the name you used at the beginning of step 1.


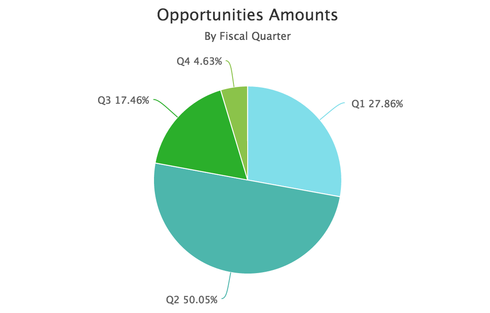
**Finished Product! **


This will give you a chart that looks like this:


Note: The Highcharts API is documented here: http://api.highcharts.com/highcharts Lots of good stuff there, and lots of interactive examples.


Great! Do you have code to show the value of a count too?


@Rob Hatch What values would need to be adjusted to have this for count as Anna asks? Or if we wanted this to work in other types of Charts.


Series List>Series Tab
Aggregate Function = “Count”
Split Type = Template.
Split Template is something like: {{Contact}} TOTAL =


Yay! Thank you for introducing the world of highcharts to me! And it’s awesome how flexible and smooth the integration is.