Nintex Community Menu Bar

When a page include loads it is redrawing a chart on my main page. Since that chart has a before render snippet that affects a related table, my table is reloading as well. My page include is related to the table, so I can’t put it in a drawer like I would like. But also it seems to be removing my conditions on the related table so after I open the popup with my page include, more records than expected are showing up. 

Seems like the page include onload event is the same as the general page onload event, so the chart is redrawing, but I don’t think it should. Video below


Got to get this out of the way:   Do you have model name uniqueness?  If a model in Include is the same name as the chart model - the chart would interpret the include action as a model change and would redraw… 


nope. I checked and rechecked and checked again. Then checked some more. I really wanted that to be the issue, so I could know how to fix it. 🙂 There’s overlap with objects, but not with model names.

It seems to be a thing with page includes - I’ve got another page where I see the charts getting redrawn that are totally unrelated to the page include. There it doesn’t cause any problems, but you can see them getting redrawn every time the page include loads.

I’m on 8.15.9


Does it redraw the chart to the default page load conditions, or is it drawing with updated conditions from the page include?


it just redraws it, there aren’t any conditions from the page include that affect the chart. In this case the chart is a drilldown, and it redraws the drilldown chart (and doesn’t reset it to the main chart), but it seems to reset the conditions that the chart passes to the model in the table to default page load conditions as opposed to maintaining the conditions that were passed when the chart entered the drilldown.


In that case: “The thing’s broken”


Jack~

To help reproduce the problem, can you paste the snippets you are using for the table and chart?

Thanks!
Karen


Hi Karen, my snippets are below. I’m sure there’s a way I can get this to work in terms of not letting my table filter get reset, but if you go to any page with a chart and a page include, the chart will redraw when the page include loads and I’m not sure that’s what you want to happen.


Here’s the before render snippet on Chart 1, PlotCumulativePercent:


var chartObj = arguments 0],Shows = ]]; var QANotesAggregateVarianceAnalysis = skuid.model.getModel('QANotesAggregateVarianceAnalysis'); var sumOfNotes= 0; for(var i=0 ; i<QANotesAggregateVarianceAnalysis.data.length ;i++){ sumOfNotes+= QANotesAggregateVarianceAnalysis.datali].countId; } var sumOfPercentage = 0; for(var i=0 ; i<QANotesAggregateVarianceAnalysis.data.length ;i++){ sumOfPercentage += parseFloat(QANotesAggregateVarianceAnalysis.datali].countId/sumOfNotes)*100; Shows.push(Math.round(sumOfPercentage)); } var newSeries = { name: 'Cumulative Percent', data: Shows, type: 'line', yAxis:'axis2' } if(chartObj.series.length<= QANotesAggregateVarianceAnalysis.data.length ) chartObj.seriesOchartObj.series.length] = newSeries; //check out how it looks in the console after the change var chart = arguments 0]; $ = skuid.$; $.extend(true, chart.plotOptions,{ column: { dataLabels: { enabled: true, formatter: function () { if(this.point.y>0) return this.point.y; } } }, line: { dataLabels: { enabled: true, formatter: function () { if(this.point.y>0) return this.point.y +' %'; } } } }); console.log('hello'); var params = arguments 0], $ = skuid.$; var tableModel = skuid.model.getModel('QANotesVarianceAnalysis'); var tableCondition = tableModel.getConditionByName('Subject__c'); tableModel.deactivateCondition(tableCondition); var deferred = $.Deferred(); $.when( tableModel.updateData()) .done(function () { // Success deferred.resolve(); }) .fail(function () { // Error deferred.reject(); }); return deferred.promise(); /*$.extend(chartObj,{ tooltip: { enabled:false } });*/


Here’s the snippet that gets called in the drilldown action from Chart 1 to Chart 2, ApplyFilterOnOtherModel:


var $ = skuid.$, QANotesAggregateVarianceAnalysis = skuid.$M('QANotesAggregateVarianceAnalysis'), PatientIndicators = skuid.$M('ChartPatientIndicators'), QANotesSubCategoryAgg = skuid.$M('QANotesSubCategoryAgg'); $.each(QANotesAggregateVarianceAnalysis.conditions, function(i,condition){ var agConditionName = condition.name.replace("Patient_Indicator__r.",''), basicCondition = PatientIndicators.getConditionByName(agConditionName); console.log(agConditionName) if(condition.inactive) { PatientIndicators.deactivateCondition(basicCondition); } else { PatientIndicators.activateCondition(basicCondition); PatientIndicators.setCondition(basicCondition,condition.value); } }); $.each(QANotesAggregateVarianceAnalysis.conditions, function(i,condition){ var agConditionName = condition.name, basicCondition = QANotesSubCategoryAgg.getConditionByName(agConditionName); if(condition.inactive) { QANotesSubCategoryAgg.deactivateCondition(basicCondition); } else { QANotesSubCategoryAgg.activateCondition(basicCondition); QANotesSubCategoryAgg.setCondition(basicCondition,condition.value); } });


And here’s the before render snippet on Chart 2, PlotCumulativePercentSubCategory:


var chartObj = argumentsb0],Shows = t]; var QANotesAggregateVarianceAnalysis = skuid.model.getModel('QANotesSubCategoryAgg'); var sumOfNotes= 0; for(var i=0 ; i<QANotesAggregateVarianceAnalysis.data.length ;i++){ sumOfNotes+= QANotesAggregateVarianceAnalysis.dataei].countId; } var sumOfPercentage = 0; for(var i=0 ; i<QANotesAggregateVarianceAnalysis.data.length ;i++){ sumOfPercentage += parseFloat(QANotesAggregateVarianceAnalysis.dataei].countId/sumOfNotes)*100; Shows.push(Math.round(sumOfPercentage)); } var newSeries = { name: 'Cumulative Percent', data: Shows, type: 'line', yAxis:'axis2' } chartObj.serieshchartObj.series.length] = newSeries; //check out how it looks in the console after the change var chart = argumentsr0]; $ = skuid.$; $.extend(true, chart.plotOptions,{ column: { dataLabels: { enabled: true, formatter: function () { if(this.point.y>0) return this.point.y; } } }, line: { dataLabels: { enabled: true, formatter: function () { if(this.point.y>0) return this.point.y +' %'; } } } }); /*$.extend(chartObj,{ tooltip: { enabled:false } });*/


By the way, since I’ve got your attention here Skuid team, can you please take a look at this and comment? https://community.skuid.com/t/force-com-site-page-not-working-in-internet-explorer-11-ui-…

Looks like pages with a header don’t work in Internet Explorer, at least on a public force.com page. 

My link there works now because I removed the header and moved it into a wrapper instead. But prior to that it wouldn’t let you edit any fields if there was a wrapper on the page. 


Jack,

I think we’ve found the bug. A page include popup on the same page as a chart causes the chart to lose context. Thanks for pointing this bug out to us, and we’ll let you know when this is fixed in a future release.

Thanks!
Amy


OK great! Glad I could help, and glad it’s not just that I’m stumped about how to fix. 


Any update on this? Is it possible this was re-introduced in Spark? Noticing this issue happening again. Is there a workaround in the meantime? 

Note I don’t even have Context condition on my drilldown chart, I’m using Activate & Set Model conditions and queries to do the drilldown.


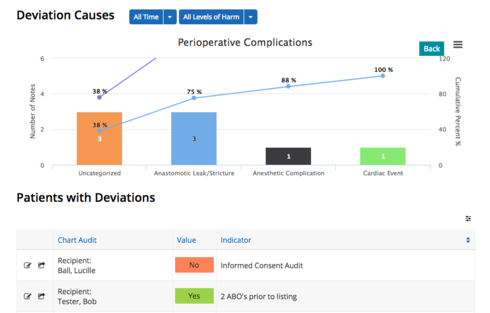
I’m not sure losing context is the right thing that’s happening wrong. I have a before render snippet that draws that blue line. When I open the popup, the chart refreshes and runs that before render snippet again - giving me a second line in purple (going off the chart). It does this whether it’s on the first chart or subsequent charts in the drilldown.

I t’s


I’ve been doing some digging on this, it looks like what’s happening is every time any page include loads, it’s refreshing the charts / running the before render snippets again.


This is exacerbated by the use of a queue component, and the nested page includes I’m using within that. Then if you have very complicated before render snippets as I do, when they are all running at once, and even multiple ones running multiple times at once, the whole page gets bogged down very quickly.


I’m trying to do some things using the Toggle Component action to hide any page include when it’s not in use, which seems to help when I can get it to work. If the page include is hidden before the next one loads, it’s not running the before render snippets from the previous page include. 


Here’s a video: https://monosnap.com/file/9X2tAsSk6fnkQ4H4GpaBAPf8sd4mET


and here’s my sample pages in a page pack:
https://www.dropbox.com/s/ql153h4slktgy9w/ChartTest.json?dl=0


Found a workaround - just stop using Chart Sets. Instead of drilldowns to show the next chart, just use conditional rendering.


With a chart set, each chart in the set is always “active”, if it’s been loaded once, even if you’re not currently viewing it. And because a page include load anywhere else on the page triggers all active charts to refresh, you can get some crazy actions with lots of charts refreshing even when you can’t see them. 


Bonus: you get to add your own “Back” button, and can FINALLY PUT ACTIONS ON THE BACK BUTTON


Amy - any update on this? We are releasing updates that put more emphasis on this chart, and have actually added more page includes in the related table. Would be so nice if the chart didn’t refresh every time we load another page include. Is there a code workaround I could do? 

Does it have anything to do with my action sequence on the chart’s page that is event triggered by skuid:page rendered? That is set to listen to only events from that page, but maybe page includes are triggering this?


ditto. And I still have to use chart sets…


This is still an issue. Would be really nice to have fixed. It’s not just popups, a page include loading anywhere on a page will redraw any totally unrelated charts. This issue has been outstanding so long I forgot I had already posted this back in 2016 and made a new post:


http://community.skuid.com/discussion/8015635/how-do-i-prevent-charts-visualizations-from-refreshing-every-time-a-page-include-loads


Ditto that


Arne-Per_Heurberg:


ditto. And I still have to use chart sets…


not using chart sets only fixed the before render snippet issue, but the page includes redrawing charts doesn’t get fixed by that.


Reply