Nintex Community Menu Bar
Question

How to make a chart . is there any video tutorial please share .

  • Jul 11, 2024 11:55 AM UTC
  • 6 replies
  • 90 views
  • Translate All
This topic has been closed for replies.

6 replies

Forum|alt.badge.img+4
  • Jul 11, 2024 12:19 PM UTC

Matrix,

Have you seen the documentation about Charts and Graphs already? Check out this link for the documentation: https://docs.skuid.com/v10.0.4/en/skuid/components/visualizations/chart/

Janick

Translate

Forum|alt.badge.img+5

Hi Janick ,
Thank you for your reply.
I have seen that documentation.
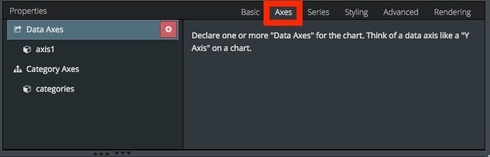
I dont have the option axes .dont know why.
I have only Basic, Series, Styling,Advanced and rendering option axes option is missing dont know why
But also i have tried but  for me its not working. can you please show me the steps with a example that you have done in past or normally with a example.
Thank you. .

Translate

Forum|alt.badge.img+4
  • Jul 11, 2024 12:19 PM UTC

Hey Matrix,

I’ve just checked the chart component and the settings on it but in my Org. I’m on Skuid 10.0.6 and was able to see “axes” settings.
What version of Skuid are you on?

Thanks,

Janick

Translate

Forum|alt.badge.img+10

If your Default Type is set to a “Pie Type” (Pie, Donut, Funnel, or Pyramid) instead of a Line Type or Scatter Type, then you shouldn’t see the Axes Tab. Select “Bar Graph” type as an example and you should see this:

7fea2b9bb80908aa08f2cfc2276fa15a4d44b8dd.jpg

Translate

Forum|alt.badge.img+5

Thank you.how to sum 5 different value and show total in pie

Translate

Forum|alt.badge.img+10

You’d probably use aggregate models.

Translate