I am following the tutorial here:
http://help.skuidify.com/m/supercharge-your-ui/l/293051-visualizations-charts-and-graphs
The tutorial is great, and I have a good idea of how to set things up, however I am having an issue at this point. The example uses Opportunities and stages and all that jazz. I set up an extremely similar graph but I used the Case object instead.
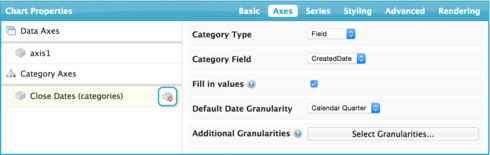
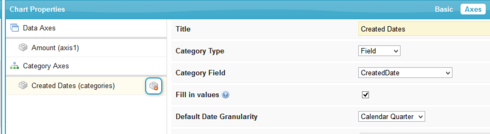
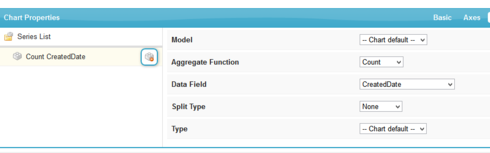
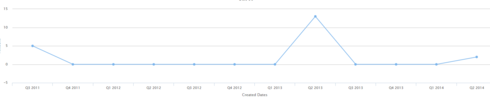
This presents a problem, as in the tutorial they use “CloseDate” which when I look at the SOQL shows pretty stuff like “2015-08-05” or “2015-06-30” however, I tried to do the same type of chart with Cases and I use “CreatedDate” which ends up showing up with gems like this:
“2015-01-29T14:27:18.000Z”
So, what is happening is that I am not able to group anything by month or day or week, instead I get hundred of individual entries. In the past when I’ve done reports manually in something like Excel, they allow me to group the dates up so that I don’t have individual entries.
I am assuming this is possible in Skuid and that I’ve missed how to do it, but I cannot for the life of me figure it out. Is this something I’d have to create another field on the object that has a short date?
Thanks.

Question
Help with graph visualization
 +6
+6This topic has been closed for replies.


Enter your E-mail address. We'll send you an e-mail with instructions to reset your password.