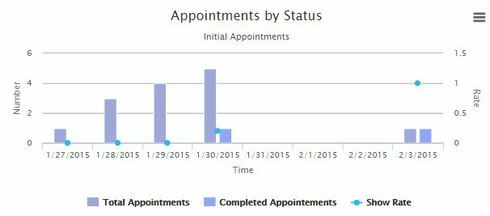
I must be missing something in Highcharts…
I have the following before render:
var chartObj = arguments[0], $ = skuid.$,<br>Appts = chartObj.series[0].data,<br> Comp = chartObj.series[1].data,<br> Shows = []; <br>for (var i = 0; i < Appts.length; i++){<br> Shows.push(Comp[i] / Appts[i]);<br>}<br>var newSeries = {<br> name: 'Show Rate',<br> data: Shows,<br> type: 'line',<br> yAxis: 'rateaxis',<br> lineWidth: 2,<br> dashStyle: 'solid',<br> connectNulls: true<br>};<br>chartObj.series[2] = newSeries;
I end up with this:
I shouldn’t need to set lineWidth and dashStyle, because those are defaults. Either way, I’m not getting a line.
What am I missing? Thanks!

