I’ve created the below chart but the line is hidden behind the columns.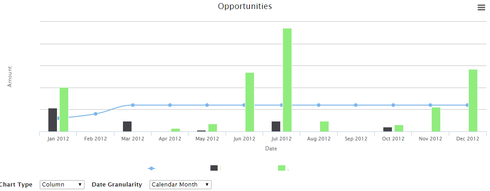
The chart was initially created with the column data as it’s data source and the line’s series was added afterwards.
Is there a way to reorder the series so that the line is displayed on top of the columns or is my only option to recreate the chart using the line series first?

Question
Displaying Line On Top Of Column On Chart
 +3
+3

Enter your E-mail address. We'll send you an e-mail with instructions to reset your password.