Nintex Community Menu Bar

Hi all, 

I have a chart that was working fine before but now is causing some issues now. 
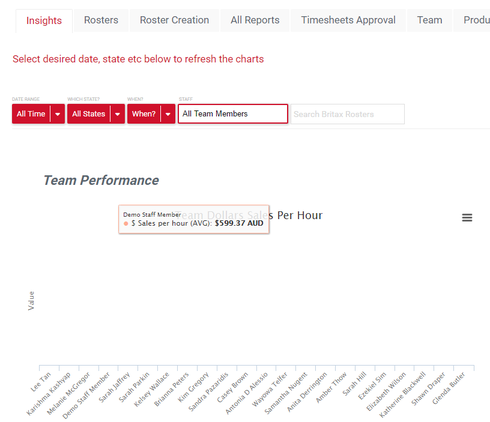
If i mouse over it is showing the data however the visualisation is not present on the chart. 

Any ideas?

Matt,

Some questions to help us investigate:

  • Has anything changed recently in your org, such as upgrading your Skuid version? 

  • What version of Skuid are you currently on?

  • Can you post a screenshot of what your chart looks like?

  • Where is the data from your chart coming from, a Salesforce object or an external data source?

Thanks!
Amy


Hi Amy,


  • As far as we can tell the org has not changed and the Skuid version is still the same.

  • We are currently using Version 8.15.14.

  • Please see the below Screenshot.

  • The data is coming from a custom SF object.


If you bring up the Chrome console (cmd-opt-j on mac, ctrl-shift-j on windows), are there any errors in the console? If so can you post a screenshot? This request is a little silly, but can you double check that the color of the charts isn’t set to white? 

Thanks!
Amy


Hi Amy,


I tried the Chrome console and got the following … (However I don’t think these are related to the issue I am having).


On the other request, this is the first thing I checked and unfortunately no there is most definitely colour in the charts. ;D


Matt,

Does this happen to anyone who tries to access the page (are there any patterns of who can or can’t see data based on profiles)? I’m wondering if there’s an issue in accessing the data because of a Salesforce permission.

Thanks!
Amy


Hi Amy, 

I have checked the permissions on all profile and user types. Also I notice that the popup when mouse over on the graph with the data being surfaced (as per the original screenshot), so I doubt that it is a data surfacing issue. 

Interesting also is that other graphs are displaying correctly.

Thanks for your help so far! I am super appreciated.

Cheers, 

Matt


Matt,

Are there any javascript or CSS resources on the page that could be interfering with the chart?
Can you copy the chart over to a new, blank page to see if it works there (if it does you’ll know something on your page is interfering with it)? The easiest way to do this would probably be to copy the XML of the chart and the model the chart is looking at.

Thanks!
Amy


Reply