
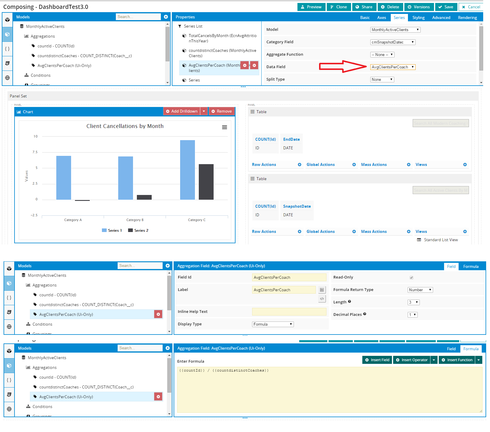
I am trying to use a Ui-only field in a chart. I can select it as the ‘data field’ in a series on a chart and save it. However, every time I select that series again it defaults to countId. This doesn’t happen with the other series in this chart, which are using regular aggregations.


Am I doing something wrong or is this a bug?


What I said on your other post applies here to.  If your UI only field is coming over as a string,  then the aggregation functions in the chart series are not going to work.  Wrap it in a “Value()” function and turn it into a number. 


Thanks, Rob.

To be clear, the Ui-only field will show up just fine in the chart.

It’s just that any time you click into the series, it will change the “data field” away from a Ui-only field.

I tried wrapping it in VALUE() and it still does the same thing, so it seems like a glitch in the system with Ui-only fields.


Reply