Nintex Community Menu Bar

The new charts functionality is a great step in the right direction. However, to replace our existing charts then we need better manipulation of the the highcharts options.


We can get around some of this by grabbing the highcharts object, doing some manipulation on properties or data and then redrawing after the initial render of the chart. e.g.


var c=Highcharts.charts[0]; // The first Chart
var s1=c.series[0]; // Closed Delivered series
var s2=c.series[1]; // Closed Not Delivered series
var s3=c.series[2]; // Open series

s1.update({name: 'Delivered', index: 2 , legendIndex: 0});
s2.update({name: 'Not Delivered', index: 1, legendIndex: 1 });
s3.update({name: 'Open', index: 0, legendIndex: 2 });

// Do some manipulation of the data here, add labels, etc

c.redraw();

But this is hacky, and we cannot change the main chart options like borders etc due to highcharts limitations in the api after the initial option setup.


So, it would be really useful in the interim (ie. until these are fully exposed in the skuid interface) if:


  1. There was an options text field in the chart setup that allowed us to override / add to the chart options before the initial render. e.g.:


chart: {
borderColor: '#cccccc',
borderRadius: 10,
borderWidth: 2,
spacingBottom: 10,
spacingRight: 30
},

title:
{
style:
{
color: '#888888',
fontWeight: 'bold',
fontSize: '14px'
}
}

  1. Allow a snippet to run after options have been setup and before the render. e.g. like the initial code above to allow manipulation of data, addition of calculations / labels, etc

Ant,

Those are interesting ideas which we will certainly consider. One of the things that we really try to promote at Skuid is a page composer experience that requires as little JavaScript from you as possible, but we absolutely want to get out of the way and let you extend the platform when needed. A “before render” snippet would definitely fit in the second category. Before we go there though, here are some ways that we try to meet those needs without having to go the snippet route.

For renaming series, we’re rolling out the ability to name series via Skuid Templates in the next release, and this may address it for you. You’ll be able to split data into series based on multiple fields this way, or just give it a more friendly title than Amount (SUM). With regards to the style options that you mentioned, they seem like pretty good candidates for options the “Style” menu in the page composer.

Those are just ideas though. We really do appreciate you taking the time to show us the areas you’re having to “hack” around to get things to work the way you want them to work. Feedback like this really does inform our development efforts.


Thanks J. Absolutely want to avoid javascript where possible, so the sooner the core functionality is there the better 🙂. I suspect (from our experience), doing things like pareto charts and coping with null data etc will be difficult to do without some custom code. Looking forward to the next releases.
Ant,

The more we thought about this, the more your idea of a “Before Render” snippet made sense. As of 6.8, you should now see an “Advanced” menu which asks for a “Before Render Snippet” when building Charts:

3f6264a3c163c60930660d72ba9a0e824affcd53.png

As you’d expect, this corresponds to the name of a snippet to be run just before the initial chart render. This snippet takes a single argument: the JS object that gets sent to Highcharts. For example:


var chartObj = argumentsb0], $ = skuid.$; $.extend(chartObj.chart,{ borderColor: '#cccccc', borderRadius: 10, borderWidth: 2, spacingBottom: 10, spacingRight: 30 });<br>

Hopefully this really will help you convert some of those charts over to Skuid charts. In any case, we’d love to hear how it goes. Thanks so much for being a part of this community, and for helping us to make our product better.


Just tried this, works beautifully.

This is what really works in Skuid. There’s a huge amount that can be achieved declaratively, but then to extend it further with code is pretty seamless.


We also just tried this and as Glenn says its seems to work perfectly. We have started to replace our existing custom code which is fantastic. Thanks for the quick turn around!


Glad it works for you guys.  The passionate voice of customer advocates like you gives us really good direction about where to tweak the angles and polish the rough spots.  We really appreciate you… 


So this works well for me on initial render of the chart. But if I then apply a filter on a table with the same model - which would normally redraw the chart with the new data - the chart doesn’t redraw. And I don’t get a Javascript error. Here’s my snippet:


//Applies presets to the chart using the Highcharts API var chartObj = argumentsu0], $ = skuid.$; $.extend(chartObj.chart,{ borderRadius: 2 }); $.extend(chartObj.tooltip,{ enabled: false }); $.extend(chartObj.plotOptions,{ series: { animation: { duration: 1200 } } });


Any thoughts?


Glenn,

I haven’t been able to replicate this. Could you paste your chart XML too?


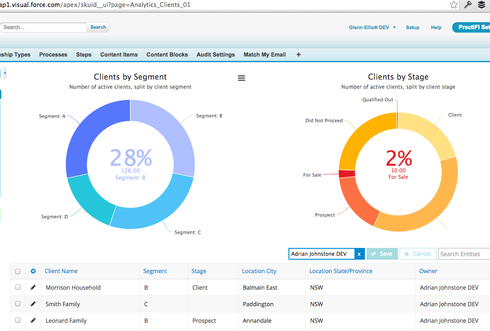
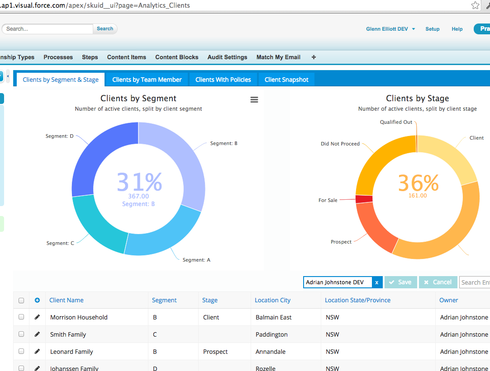
Hey J … on further testing, I may have been slightly off in my earlier assessment. The issue seems not to be related to the snippet, but instead is related to using a chart in a page include. I have a page called Analytics Clients, which has an included page called Analytics Clients 01 with a chart and a table on the same model. If I run Analytics Clients 01 by itself, when I filter the table, the chart redraws with the new data. If I instead run Analytics Clients, applying the same filter redraws the chart but with the old data.


E.g. running Analytics Clients 01 and applying the filter on Adrian gives 126.


Running Analytics Clients and applying the same filter on the same chart gives the full dataset result of 367.


Any thoughts on this? Puts a bit of a dent in my grand analytics design (which is seriously grand).


An update: in my circumstance, there may have been conflicting model names between the container Skuid page and the included Skuid page. They were clearly different when viewed through the page composer, but I removed all the models from the container page just in case and the problem has disappeared. Odd.

Anyway, the grand analytics design is back on track.


Glenn,

Sorry to have dropped out for a bit there, but I’m glad to hear you’re back on track!

We seriously can’t wait to see your seriously grand data analytics design in action.