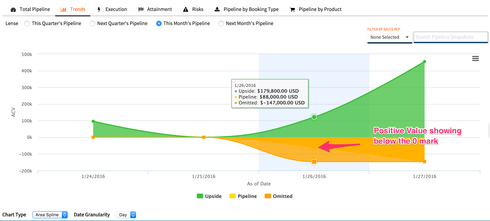
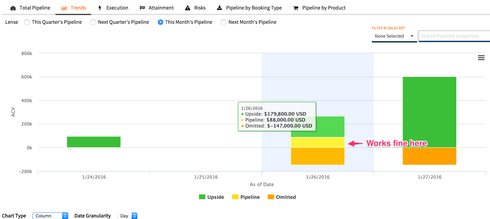
Mansour,
I think the way to address this is a Highcharts setting that we don’t currently set: threshold. It looks like it’s particular to Area/Areaspline charts, but I wasn’t familiar with it before today, so I can’t say for sure. Here’s a jsFiddle showing it in action. At present, you’ll have to set this with a Before Render Snippet on your Chart to set it. Does that help?
Thanks J, that worked great!
Here’s the snippet if anyone else runs into this:
var chartObj = argumentst0],
$ = skuid.$;
$.extend(chartObj,{
tooltip: {
shared:true,
enabled:true,
crosshairs:true
} ,
plotOptions:{
series:{
threshold: 0
}
}
});
Spoke too soon, that snippet removed stacking…
Try a recursive $.extend:
$.extend(true,chartObj,{ ... (Setting really cool options here) ... });


