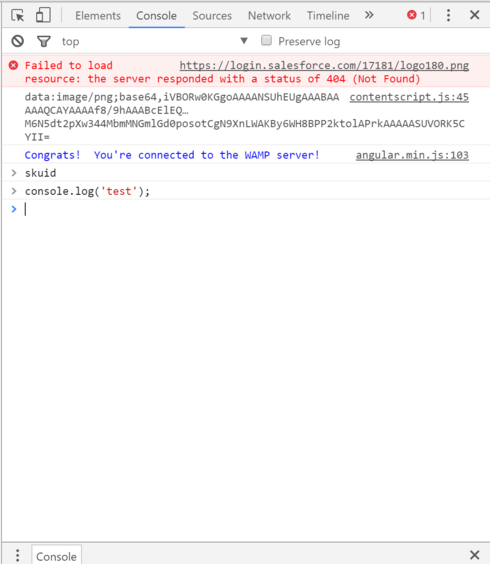
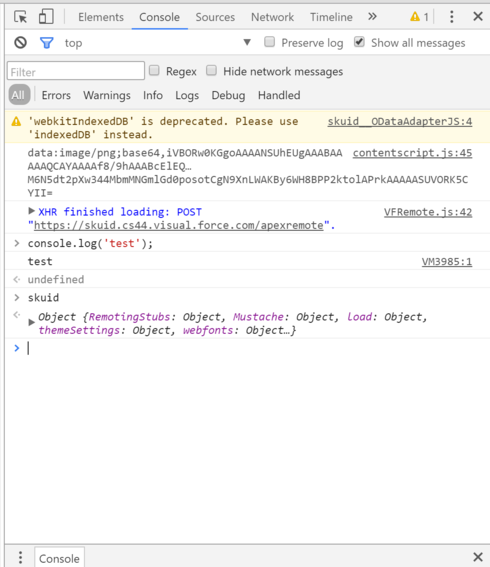
Occasionally when I open the browser’s javascript console and try to run something from the skuid api I get an error message indicating the skuid is not defined. If I refresh the page, skuid is definied in the console again.
Any ideas why that would be happening? I’ve just noticed in the last couple weeks or so.
Do you have any Chrome extensions installed? I’m not sure why, but Chrome will occasionally default the JavaScript Console to being the console for either (a) one of your Chrome Extensions or (b) an iframe within the parent page.
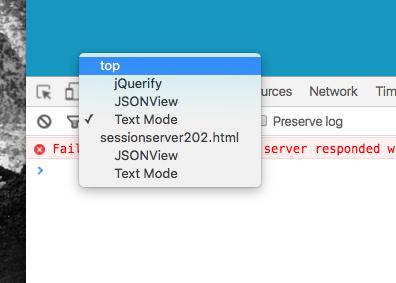
You can tell whether this is happening by looking at the the top-left panel in Chrome. For instance, I have the Chrome extensions, “Text View”, “JSON View”, and “jQueryify”, and sometimes “Text View” is the default “Frame” in context of which the Console is rendered:
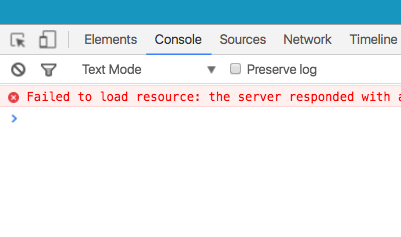
If this is happening to you, just click where it says “Text Mode” (or whatever you’re Chrome plugin’s name is) and switch to “top” or whatever the correct window frame name is — this will be different depending on your runtime environment, but usually you just have to try a few things to find the “correct” frame.
Fascinating. thanks!
I concurr with you Matt - that this has gotten worse in the last few weeks. I think Chrome introduced a problem in a recent update… Whoda thunk…
Even with my contest as ‘top’ I’m having this issue with my skuid page. But it’s working with the skuid page builder and on any other site.
Here’s a picture of the console on a skuid page:
Here’s a picture of the console on the skuid page builder:
Unfortunately, this is a bug in Chrome. They should have it fixed in a later release.
Aw man. Debugging is insanely difficult (think alerts everywhere). Is there a workaround for this or do I need to use firefox?
How come I’m not seeing other people complain about this, is it only when you override a page layout?
Shmuel, take a look at Zach’s first response for the solution.
The workarounds are to use a different browser, or use Chrome Canary. We’ve also noticed that if you turn of the salesforce header it seems to work as well. I think it has something to do with the error message in the developer console causing the developer console to stop working.
Shmuel, until the next version of Chrome gets released, you’ll need to use a different browser to get the console debugging output that you’re expecting. Firefox, Safari, or Chrome Canary should work fine.
Other people have been complaining about this, there’s another community thread related to the Chrome issue.
Ah okay thanks guys!
Matt, I attempted this solution to no avail 
Ah, I didn’t read your post carefully enough. Sorry!
Having the same issue. is there a solution for this yet?
Enter your E-mail address. We'll send you an e-mail with instructions to reset your password.

