Can you share the XML for the page? Better yet, can you create a clone of it using only standard fields and objects?
Here is the XML of a vanilla test page using the Opportunities object. Amount is a currency field that displays as a number in the chart. Please let me know if you need anything else. I appreciate your looking into this!
<skuid__page unsavedchangeswarning=“yes” personalizationmode=“server” showsidebar=“false” showheader=“false”>
<skuid__grid uniqueid=“sk-1niz-17632” flexDirection=“row” justifyContent=“flex-start” alignItems=“flex-start”>
<skuid__chart model=“Opportunities” maintitle=“Opportunities” type=“donut” uniqueid=“sk-1nkB-29874”>
pie
donut
</skuid__chart>
</skuid__grid>
</skuid__page>
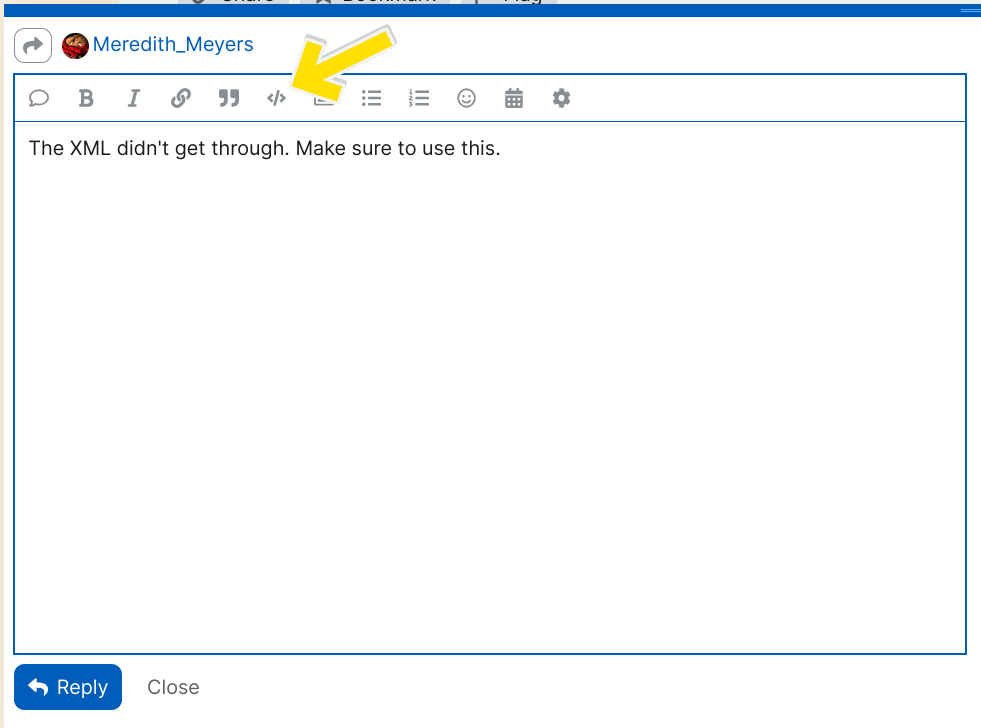
The XML didn’t get through. Make sure to use this.
Oops here it is.
<skuid__page unsavedchangeswarning="yes" personalizationmode="server" showsidebar="false" showheader="false">

	<models>

		<model id="Opportunities" limit="20" query="true" createrowifnonefound="false" datasource="salesforce" sobject="Opportunity">

			<fields>

				<field id="RecordTypeId"/>

				<field id="RecordType.Name"/>

				<field id="Amount"/>

				<field id="StageName"/>

			</fields>

			<conditions>

				<condition type="fieldvalue" value="0.0" enclosevalueinquotes="false" field="Amount" operator="gt"/>

			</conditions>

			<actions/>

		</model>

	</models>

	<components>

		<skuid__grid uniqueid="sk-1niz-17632" flexDirection="row" justifyContent="flex-start" alignItems="flex-start">

			<divisions>

				<division minWidth="100px" ratio="1">

					<components>

						<skuid__chart model="Opportunities" maintitle="Opportunities" type="donut" uniqueid="sk-1nkB-29874">

							<dataaxes>

								<axis id="axis1"/>

							</dataaxes>

							<categoryaxes>

								<axis id="categories" categorytype="field"/>

							</categoryaxes>

							<serieslist>

								<series valuefield="Amount" splittype="field" aggfunction="sum" splitfield="StageName"/>

							</serieslist>

							<colors/>

							<legend layout="horizontal" halign="center" valign="bottom"/>

							<allowedtypes>

								<type>pie</type>

								<type>donut</type>

							</allowedtypes>

						</skuid__chart>

					</components>

				</division>

			</divisions>

		</skuid__grid>

	</components>

	<resources>

		<labels/>

		<javascript/>

		<css/>

		<actionsequences/>

	</resources>

	<styles>

		<styleitem type="background" bgtype="none"/>

	</styles>

</skuid__page>
I wish it were easier but the formatting of the data labels isn’t a declarative method.
Here are the resources used to make the snippet to format the labels.
 Highcharts

A format string for the data label. Available variables are the same as for formatter.
https://www.highcharts.com/docs/chart-concepts/labels-and-string-formatting
 jsfiddle.net
Test your JavaScript, CSS, HTML or CoffeeScript online with JSFiddle code editor.
Here’s where to select the snippet.
Here’s the XML with the tiniest javascript snippet I ever made. 
<skuid__page unsavedchangeswarning="yes" personalizationmode="server" showsidebar="false" showheader="false">

	<models>

		<model id="Opportunities" limit="20" query="true" createrowifnonefound="false" datasource="salesforce" sobject="Opportunity">

			<fields>

				<field id="Amount"/>

				<field id="StageName"/>

			</fields>

			<conditions>

				<condition type="fieldvalue" value="0.0" enclosevalueinquotes="false" field="Amount" operator="gt"/>

			</conditions>

			<actions/>

		</model>

	</models>

	<components>

		<skuid__grid uniqueid="sk-1niz-17632" flexDirection="row" justifyContent="flex-start" alignItems="flex-start">

			<divisions>

				<division minWidth="100px" ratio="1">

					<components>

						<skuid__chart model="Opportunities" maintitle="Opportunities" type="donut" uniqueid="sk-1nkB-29874" rendersnippet="beforeRender">

							<dataaxes>

								<axis id="axis1"/>

							</dataaxes>

							<categoryaxes>

								<axis id="categories" categorytype="field"/>

							</categoryaxes>

							<serieslist>

								<series valuefield="Amount" splittype="field" splitfield="StageName" aggfunction="sum" splittemplate="{{StageName}}" innerContentTemplate="$ {{Amount}}"/>

							</serieslist>

							<colors/>

							<legend layout="horizontal" halign="center" valign="bottom"/>

							<allowedtypes>

								<type>pie</type>

								<type>donut</type>

							</allowedtypes>

							<styles>

								<spacing/>

							</styles>

						</skuid__chart>

					</components>

				</division>

			</divisions>

		</skuid__grid>

	</components>

	<resources>

		<labels/>

		<javascript>

			<jsitem location="inlinesnippet" name="beforeRender" cachelocation="false">var params = argumentsa0];


params.seriesm0].dataLabels.format = '$ {y:,.2f} USD'</jsitem>

		</javascript>

		<css/>

		<actionsequences/>

	</resources>

	<styles>

		<styleitem type="background" bgtype="none"/>

	</styles>

</skuid__page>
That is amazing! The tiniest snippet made the biggest difference. Many thanks!


