
Been playing around with the highcharts API to show the numbers on top of bars/columns instead of having users hover (see inline snippet below) and so far, this has worked great.
The only issue is when using this inline snippet on a UI-Only formula field, it goes all-out with digits. Any ideas?
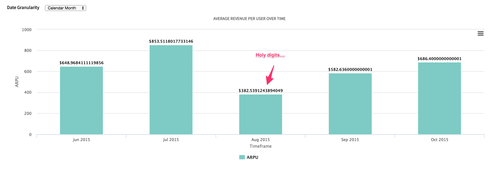
The image below is taken with a UI-Only formula field that has a length of 4 and 2 decimal points.
**Here is the formula if it matters: **
IF({{Core_License_Count__c}}<1,0,({{ACV__c}}/{{Core_License_Count__c}}))
Here is the inline Snippet
var chartObj = arguments[0], $ = skuid.$; $.extend(true, chartObj.plotOptions,{ bar: { dataLabels: { enabled: true, format: "{y}", } } }); $.extend(true, chartObj.plotOptions,{ areaspline: { dataLabels: { enabled: true, format: "{y}", } } }); $.extend(true, chartObj.plotOptions,{ funnel: { dataLabels: { enabled: true, format: "${y} in {point.name}", } } }); $.extend(true, chartObj.plotOptions,{ column: { dataLabels: { enabled: true, format: "${y}", } } }); $.extend(true, chartObj.plotOptions,{ pie: { dataLabels: { enabled: true, format: "{point.name} {y}", } } }); $.extend(chartObj,{ tooltip: { enabled:false } });
