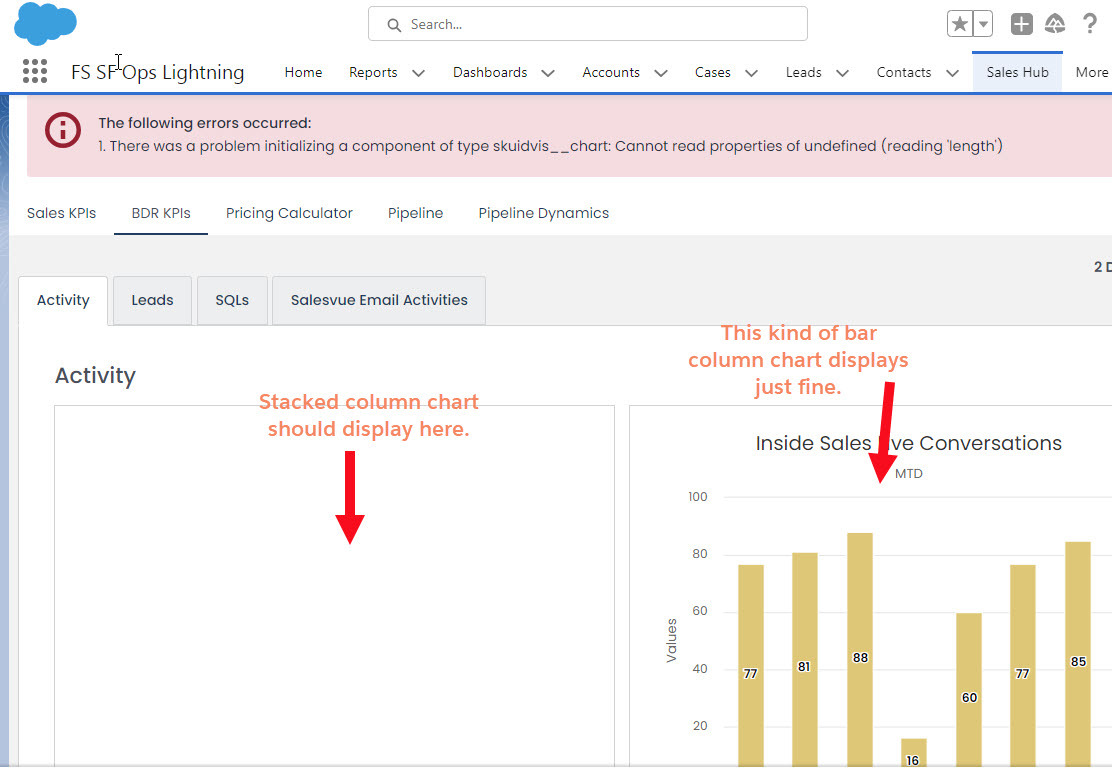
Defect/Issue Description:

I am getting error of “Cannot read properties of undefined (reading ‘length’)” in stacked charts. This is in both column and bar charts. The chart also does not appear.


Environment:


  • API Version: v2

  • Release: Edinburgh Update 1

  • Release version: 16.1.4

  • Platform: Salesforce

Brief Summary of the Defect/Issue:

When loading pages with a stacked chart (both bar and column), the chart does not display and the error described above is displayed.


Action Performed:

I upgraded to Edinburgh Update 1 today and I believe the issue started just after that. Users log in, view the skuid page that has the chart and they get the error. They are not interacting with the chart.


Expected Result:

A stacked column chart of Inside Sales Activities MTD categorized by owner’s last name and split by activitiy type should display.


Actual Result:

Chart does not display and error described above appears.


Hey @Jamie_Buck-Tomek, thanks for reporting this issue. I did some testing and so far I haven’t been able to reproduce the issue where stacked column charts aren’t working in Lightning in 16.1.4.


Here’s the page I’m using.


<skuid__page unsavedchangeswarning="yes" personalizationmode="server" showsidebar="false" showheader="false">
<models>
<model id="Opportunities" limit="" query="true" createrowifnonefound="false" datasource="salesforce" sobject="Opportunity">
<fields>
<field id="Amount"/>
<field id="StageName"/>
<field id="IsClosed"/>
<field id="CloseDate"/>
</fields>
<conditions/>
<actions/>
</model>
</models>
<components>
<skuid__chart model="Opportunities" maintitle="{{Model.labelPlural}}" type="column" uniqueid="sk-WPK-12885" stacking="true">
<dataaxes>
<axis id="axis1" title="Amount"/>
</dataaxes>
<categoryaxes>
<axis id="categories" categorytype="field" field="CloseDate" fillvals="true" dategranularity="calmonth"/>
</categoryaxes>
<serieslist>
<series valuefield="Amount" splittype="field" modelId="Opportunities" categoryField="CloseDate" splitfield="StageName"/>
</serieslist>
<colors/>
<legend layout="horizontal" halign="center" valign="bottom"/>
<styles>
<spacing/>
</styles>
</skuid__chart>
</components>
<resources>
<labels/>
<javascript/>
<actionsequences/>
</resources>
<background/>
<interactions/>
<surfaces/>
</skuid__page>

Let me know if there’s anything I’m missing… It looks like the chart is in a Skuid tab in a LIghtning tab? If you’re able to create a simplified version of your page that we can use for testing, that would be great. Check out this post for tips: How to create a good test page.


Hey Jamie, just wanted to loop back and let you know the team has been able to reproduce this is aware of the issue and we’re looking into it tupdate - we haven’t been able to reproduce locally yet].


Looks like the issue happens when the chart (1) has a split and (2) is based off an aggregate model which is why my first page didn’t reproduce the issue.


Yeah, it seems to be that specific situation. Glad you could narrow it down.


Good morning @Jamie_Buck-Tomek, just wanted to close the loop here. It looks like the issue should be resolved in 16.1.6. You can install the update in Sandbox and confirm


Release Page
Best Practices for Upgrading


CORE-4786

Fix aggregate model regression where date field values returned from Salesforce were evaluated as the incorrect data type


Reply