I have a chart that when refreshed it consistently displays the center text large but corrects itself when I hover over the chart.
The chart is a bit nested so here is the hierarchy of the layout.
Page > Tab > Page Include > Panel Set > Fixed width Panel > Chart
Any suggestions on how I can resolve? Maybe a way to force a redraw or something along those lines. I should note that it doesn’t seem to happen when the data is required and the chart is redrawn and animated.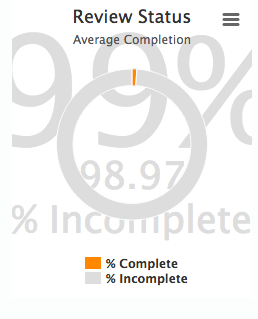

Page 1 / 1
I’ve been getting that too and I use a similarly nested approach.
I get it on other charts types too, such as column and pipeline.
It seems to happen when the model returns a sizeable dataset. For example, I haven’t seen it at all when I use aggregate models that return <200 rows. But if I have a basic model that returns 1200 rows, it happens on every page load.
Thanks for the report. We know that is an issue. Consider it acknowledged.
Rob, any ETA for this? It still seems to be an issue.
Reply
View our Community Site Map

Enter your E-mail address. We'll send you an e-mail with instructions to reset your password.