I am trying to configure a chart so that when I click on a series I can show details that make up the information summarized in that series. My Chart is running on an aggregate model, but the level of detail I need requires the pop up to access a different model. However, Both the Aggregate Model and the Detailed Model are both using the Opportunities object in Sales Force. Every time I click the series on the chart the pop up “Pops Up” but no data is returned. I defined the context of the popup to be the list of Id(s) in the context, I even tried to change the context to be the common fields between the 2 models with no luck. Please help…

Page 1 / 1
Jeff,
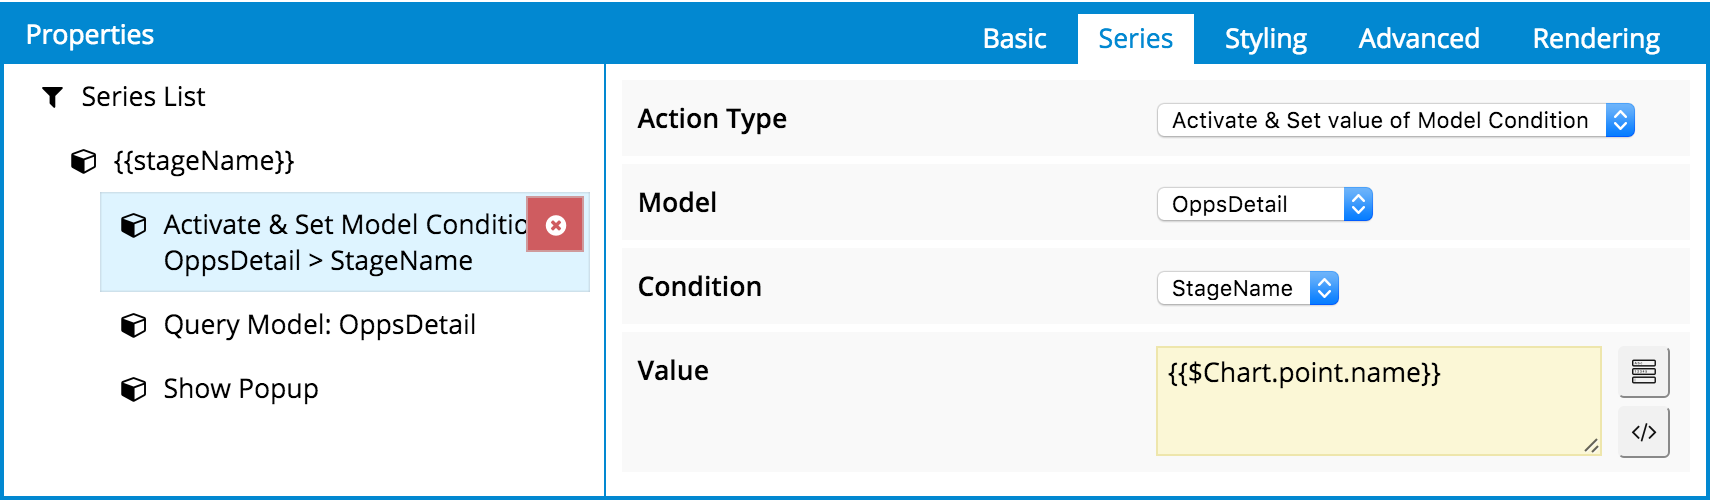
This should be doable, but if your first chart’s model is an aggregate model, the “list of Id(s) in context” approach won’t work. Let’s say your two models are named OppsAgg and OppsDetail. OppsAgg is summing Amount (alias sumAmount), grouping by StageName (alias stageName). OppsDetail has a Filterable Default Off condition named StageName, and has Load Model data on page load unchecked. Rather than using Context Conditions to filter out rows, you’re going to need to set that StageName condition and requery that OppDetail model as a part of your Series On-Click action. After that requery, display the popup which contains the chart on the OppsDetail. Something like this:
Side note, here’s a good thread on the $Chart merge variable. Does that help?
Thanks for your response, but I was not able to make it work. I think I may be missing something fundamental… I wasn’t able to reproduce was the {{StageName}} as the name of the series. When I create the series, in order for the bar chart to show up, I have to use sumAmount. In the example I’m building I have a simple bar chart that shows sum of amount by StageName as the axis. My goal is when I click the column for a given stage name that is returns me rows from OppsDetail where the StageName is the stagename associated with the column I click.
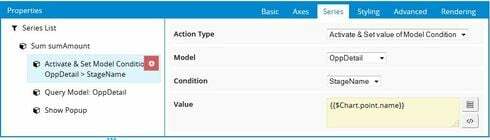
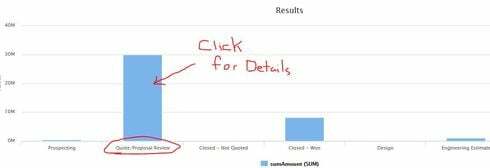
In the example I’m building I have a simple bar chart that shows sum of amount by StageName as the axis. My goal is when I click the column for a given stage name that is returns me rows from OppsDetail where the StageName is the stagename associated with the column I click. See Below:
I tried the config above by passing both {{$Chart.point.name}} and {{$Chart.point.series.name}}
I get an empty pop up in both cases so I’m assuming I am still not setting the StageName value correctly.
Thanks for any additional help you can provide.
Ha! I figured it out. I had to add a DrillDown inside my chart so I could name the series in Chart 1. Then I could alias StageName. Thanks for your help.
Glad you got it figured out.
View our Community Site Map

Enter your E-mail address. We'll send you an e-mail with instructions to reset your password.