Hi I’ve been pulling my hair to get this to work since yesterday, but now i give up and need help lol
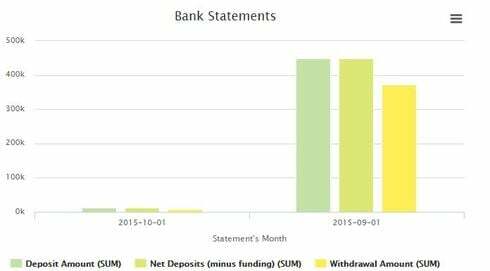
I created a chart with 3 series from same model , each a SUM of a different data fields and all 3 with same category (statement’s Month)

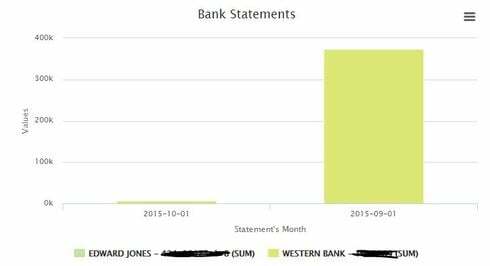
It works fine until I try to add a split field and turn stack series option"on" on all 3 series (all 3 have same Split field)
When i add split field on all 3, i only see 1 serie now and not even split/stacked as expected

What happens to the stacking and other 2 series?
Even if turn off Stack Series option, same results.
Here’s a sample of one of the serie in case I did something wrong:

Kind of lost at this point and would appreciate any help
Thx


