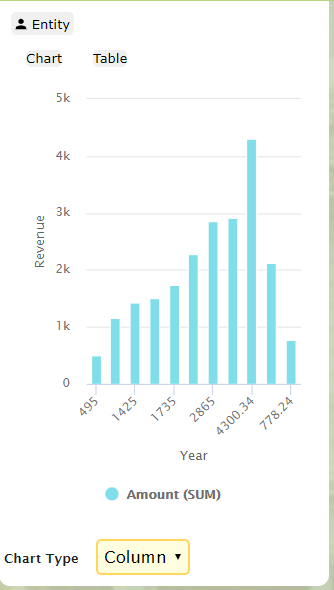
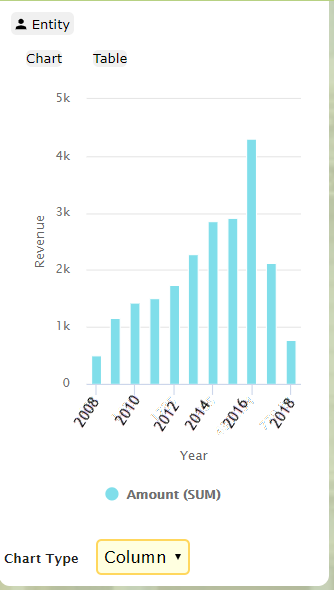
I am having trouble figuring out how to change the axis labels on charts.
I’ve gotten my model grouped by “CALENDAR_YEAR” and my category axis using the same model field. So my chart looks great, except it shows the total each year instead of the year.
I would like it to look like this:


