
I have a simple apex class which returns a list of a simple class of an Integer and 2 Doubles. I have set up a model to call the class using REST and can display the return values in a table no probs. However, when I try to display the data in a chart, with the Integer on the Category (x) axis and the 2 Doubles on the Data (y) axis, the chart only ever displays 1 of the Doubles on the Data axis - whichever is second in the Series list.


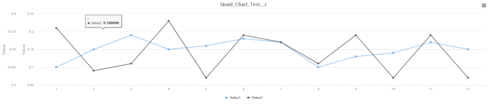
This is what it should look like (using a SF model):


But this is what I get:


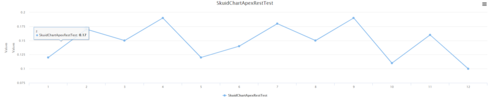
Does anybody have any ideas what is going on?

Hi Mark, could you please share some more details, like screenshots of the chart settings, a screenshot of the table, a screenshot of the model fields, etc ?


Hi Luzie,

I’ve granted you access to the sandbox - Org Id: 00D0Q0000008b7H

The skuid page is called SkuidChartApexRestTest

Let me know if you’d prefer screenshots

Cheers,

Mark


Thanks Mark, login access is fine. I will check it and let you know my findings 🙂


Mark, looks like I found the reason for the issue. The fields “Value1” and “Value2” have no Label (go to the model, click on the field, see that “Label” is empty). A small hint was already in your screenshots, because the line’s name is not “Value1” or “Value2”, but it’s the model name (SkuidChartApexRestTest). It seems like if there are no labels, the chart can’t distinguish the fields and only shows the last value of the list and displays the model name. Please add Labels to your model fields and let me know the outcome 🙂


Hi Luzie,

LOL - you live and learn.

Many thanks for sussing it out for me

Cheers,

Mark


You’re welcome, thanks for the quick feedback!


Reply