Is there any way to restrict the number of decimal points the Average aggregate function uses?
I am getting a huge number of decimal places in my chart. Not causing any functional problems, but doesn’t look the best!
Thanks in advance.

Page 1 / 1
Yup. A snippet for this.
var chart = arguments[0], chart.tooltip.formatter = function () { return this.x + '(AVG): ' + Math.round(this.y) ; };
Put the snippet name here.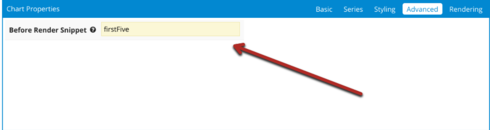
Thanks Pat. Looks like you are digging into the HiCharts API pretty hard…
And this: J told me at lunch that this issue will be fixed in our next release…
Sam,
Pat’s snippet will work, but try setting chart.tooltip.valueDecimals if you want to keep the rest of the formatting at the default, but limit the number of decimals.
I do want to mention that making our tooltips a little smarter when it comes to the number of decimal places will be included in our next patch release. Basically, Skuid will automatically limit the number of decimal places shown in the tooltip to whatever your value field’s metadata specifies. If none is specified for your value field, the tooltip will display as it did before.
Also, if you want to make those bars a little wider, try turning Stacking on:
Thanks for all the replies. Problem solved!
This script throws an error as of today looks like you can’t access tooltip any more?
Is this in reference to your other post? If so, I just wanted to close the loop on this thread for anyone who might come across it. Thanks!
Yep it is, thanks  Apologies for the cross posting, was doing the same thing as the solution here now no longer works. Checking out the solution provided on the other thread now :)
View our Community Site Map

Enter your E-mail address. We'll send you an e-mail with instructions to reset your password.