
Hello,


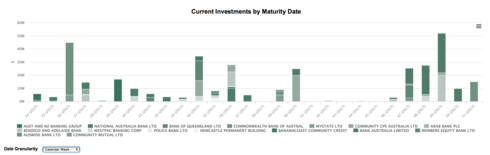
I default the chart to have a Date Granularity of Calendar Month, I also give users the option to use Calendar Week, Calendar Quarter and Calendar Year.


Calendar Month, Calendar Quarter and Calendar Year all display with a label that is easy for the user to follow while Calendar Week uses the week number. Has anyone come up with a solution to show the date for the start of the week rather than the week number?


Cheers


Damien


Damien,

Add a text field to your object.  Then add a Workflow rule that will update this field from your chosen date field. For the Field Update, use this sample formula for getting the start of the week-> https://success.salesforce.com/answers?id=9063A000000DkIlQAK.  Just make sure that you change the date to text.

Now you can group by this text field and use it on the x-axis of the chart.

Thanks,

Bill


Thanks Bill, that works perfectly


Hello Bill,

I just did some more rigorous testing and given I’m now using a text field there is no option to “Fill in Values” which would show the weeks where there is no underlying data as blank. Is this something you had to overcome or did you have data for each week so it isn’t a problem?

Cheers

Damien


Damien,

If the date field is not required for entry, then you’ll have to deal with the missing value.  I’d add a second workflow rule to update text field with ‘Missing Value’ (or whatever you want).  You’ll need to add a condition to both workflow rules.  For the first rule (the one that sets the text field), check if the date field is not equal to (empty field).  For the second rule (the new one), have it set ‘Missing Value’ when the date field equals (empty field).

Thanks,

Bill


Thanks Bill