I am trying to create a dashboard for our app that shows budget vs actual for labor and expenses. I want to have a donut chart that show the % of the budgeted amount that the actual is. The full circle is the budgeted amount, the slice is the value of the current actual and the center is the %

Page 1 / 1
Hmmm … don’t work with pie charts too often but you could likely do this by getting the actual amount and yet to be used amount in two separate models/series. Basically one row each with the respective amounts.
Model#1: YetToBeUsedFromBudgetAmount
Model#2: ActualAmount
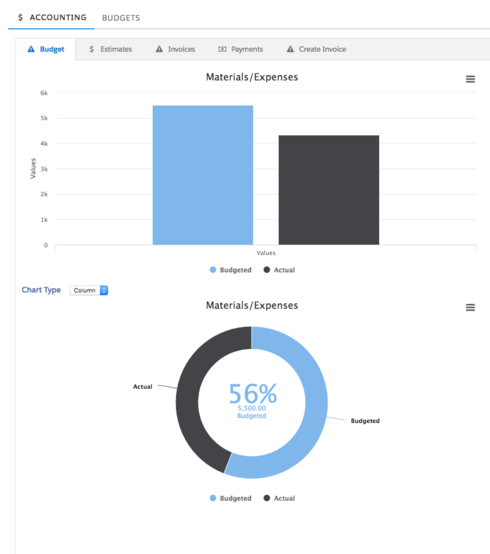
I can show the series but the problem is the donut shows them as separate amounts when what i want is the actual to cover the budgeted as we use it. In this case the number in the middle should be 78% mean we have used 78% of our budgeted expenses.
i guess what i am actually looking for is more like a guage chart but not sure how to do that in skuid
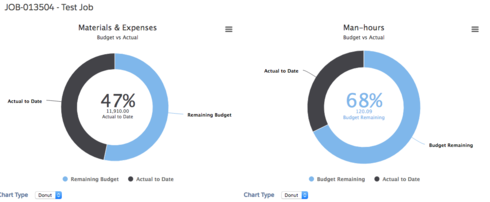
I may be alone out here but just in case, we got this to work by charting two series. We rolled up the actual usages and set one series as the total. We then set the other series to the (budget amount minus the rolled up amount.) Then bazinga! we have a sorta gauge chart
Da man!
not alone! Thanks!
Reply
View our Community Site Map

Enter your E-mail address. We'll send you an e-mail with instructions to reset your password.