I have a SFDC Lighting per-release development environment. I installed

Skid into it. The Additional Chart Types functionality doesn’t work as planed. It only shows the default chart appropriately. All other chart selections are the same. See Setup images and issue image.


See set up
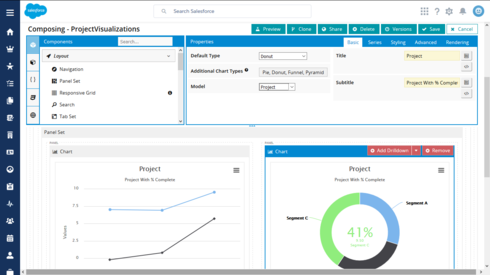

More details of setup
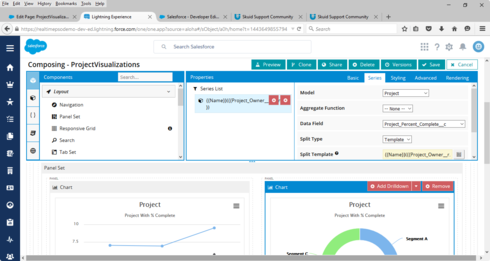

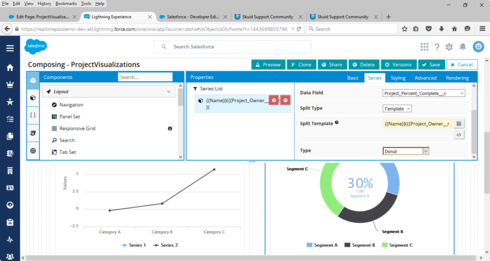
More details of setup. This image shows Type: Donut, but I have tried with Pie, etc.

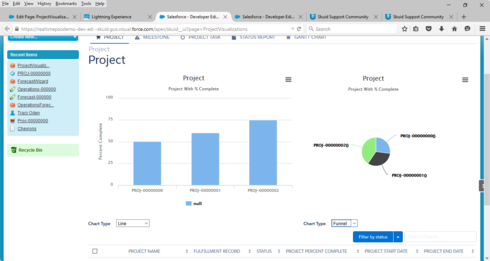
Issue: Example of Additional chart. Funnel selected, but showing Pie. It should show relevant chart.
Very strange.  Would you mind granting us login rights to your org?  Then sending us an email (Support@skuidify.com) with the Org ID and the name of the page. 

We’ll take a look. 


Hi, I have granted access. Org ID 00DB00000001wTU


I deleted the old one having the problem and rebuilt the page using XML. Same issue. Please view the ProjectVisualizations Page.


This issue has been resolved. I discovered what caused the error…


Thanks for letting us know that it’s resolved.  What was causing it?


In the Series Tab, the ‘Type’ field should have been Default. Instead I tried to match it with the chart selected in the ‘Default Type’ field in the Basic Tab. I changed the Series Tab’s ‘Type’ field back to Default and it works just fine.  Thanks for your interest in helping.


Glad you got this worked out.  . 


Thanks so much for your help!