
This may be a long shot but thought I'd check to see. Client wants a more complex export of data instead of just the data put into record rows.


Example - 
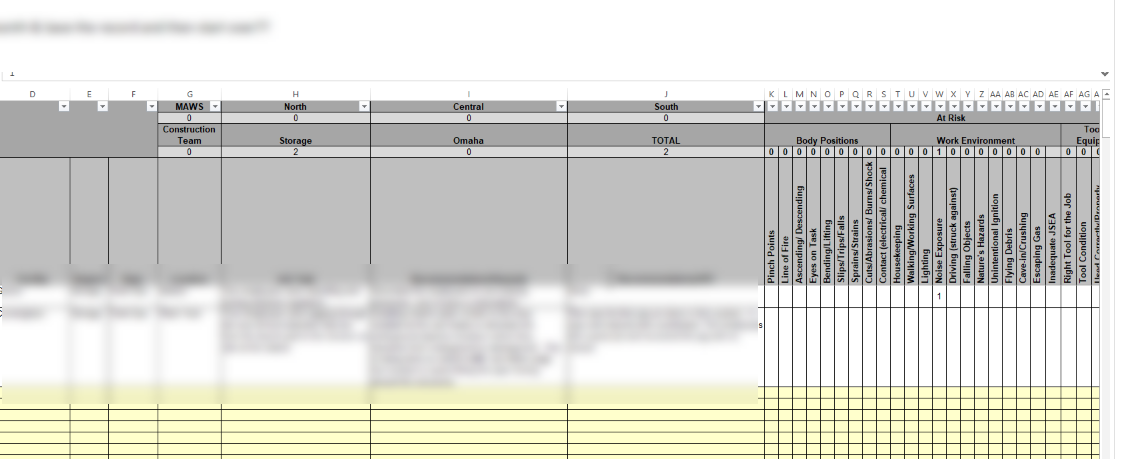
Flipping columns headers vertical instead of horizontal. 
Additional Counts & Header Sections to group columns.


I've not seen anything like this in a 3rd party conversion into Excel Export, outside of manipulating the data in Excel with this layout.  I personally have done this type of thing in an SSRS Report but not an option.


I can create the Stored Procedures to populate the data into a list view but wasn't sure if there was anything else I could do.  ** Keep in Mind I can not modify the CSS and trying to keep things OOTB with some simple coding options 

See Image

13732i5EACBED70CD356EC.png

Hi AAschenbrener,


It sounds like Power BI might be the option for your client. I'm not sure if the out-of-the box Excel Export has this feature yet. I would suggest logging a feature request on ideas.k2.com.


Good day AAschenbrener


I would like to suggest using Power BI as suggested by my colleague. I would, however, add to this and say you can use the K2 Process Analytics template for power BI. This is very easy to with and a quick solution to your request. For more information, I have attached documentation on this template if you do decide to explore it.


Documentation:


https://powerbi.microsoft.com/en-us/blog/explore-your-k2-process-analytics-data-with-power-bi/


Best regards


Jacques.


I was able to figure out how to use the oDATA API for Excel Export to get what I needed. Power BI / Tableau would've been my first idea however that's not a tool I'm able to utilize in my existing position. I did create a support ticket with K2 on the issue I was having with loading 25+ columns on a view.

Reply