Can someone tell me whats wrong here? Does escalation rules that has timing set to minutes affect this?
For example, if the Destination Queue refresh interval is set to 3 mins, and there are multiple Destintation Queues containing OUs or Groups with many members, it could potentially create many transaction log records.
I would suggest that you perform a SQL Trace on the K2 database for a couple of hours, in order to determine what activities are taking place. This should preferably be done when there is little process activity on the system, so that you will trace mainly system activities.
It is a problem which we have because of the number of transactions being processed in SQL server. It makes the log files grow very rapidly. Depending on the importance of the Log data, you can set the recovery model in SQL from Full to simple. It will clear all the transaction logs once it has been completed. The con is that all data will be lost in case of a system crash or failure since the last SQL backup, and not till point of failure. If the log data is important, one can look at a good DB maintenance program where a Full DB backup must be done at least once a week and a transaction log backup every evening and then to truncate and shrink it.
Lenz le Roux
Thanks for sharing! I have solved my problem.
Hi all,
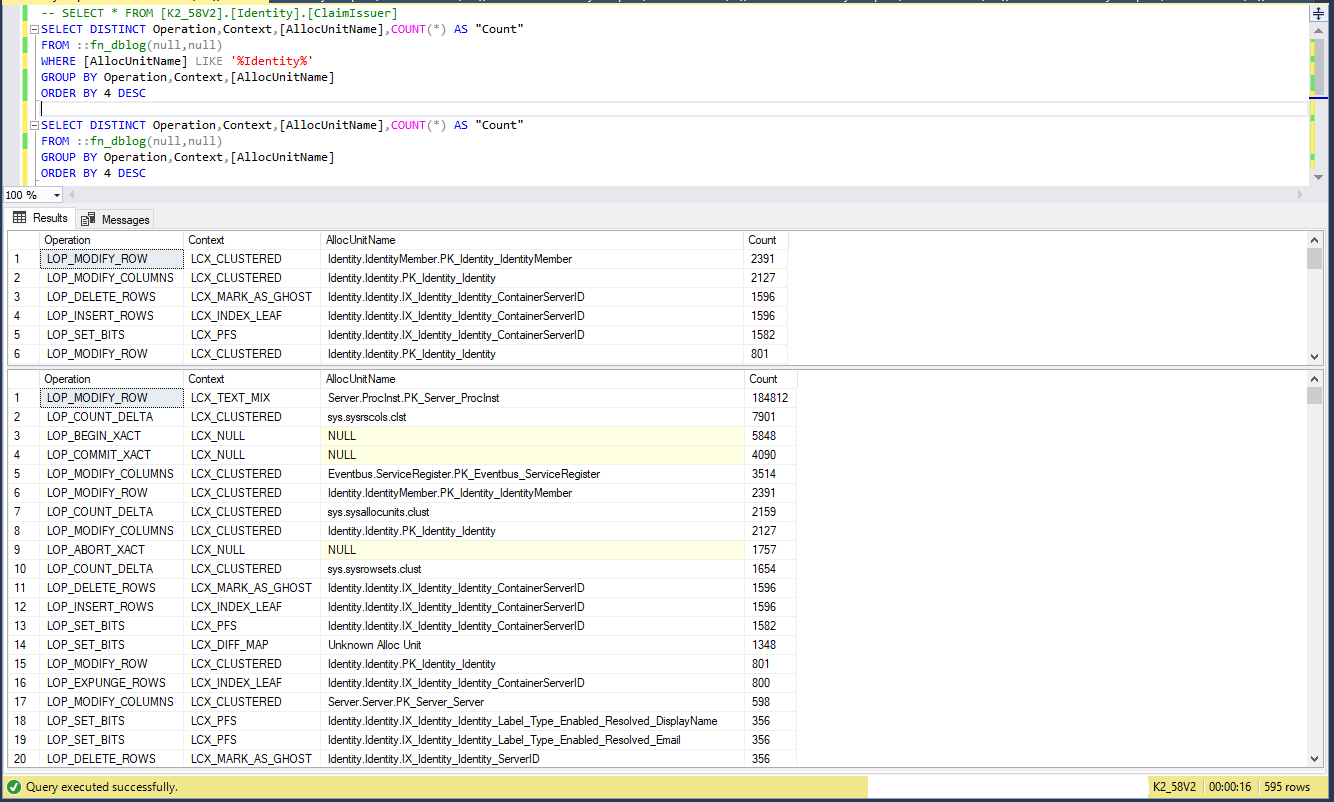
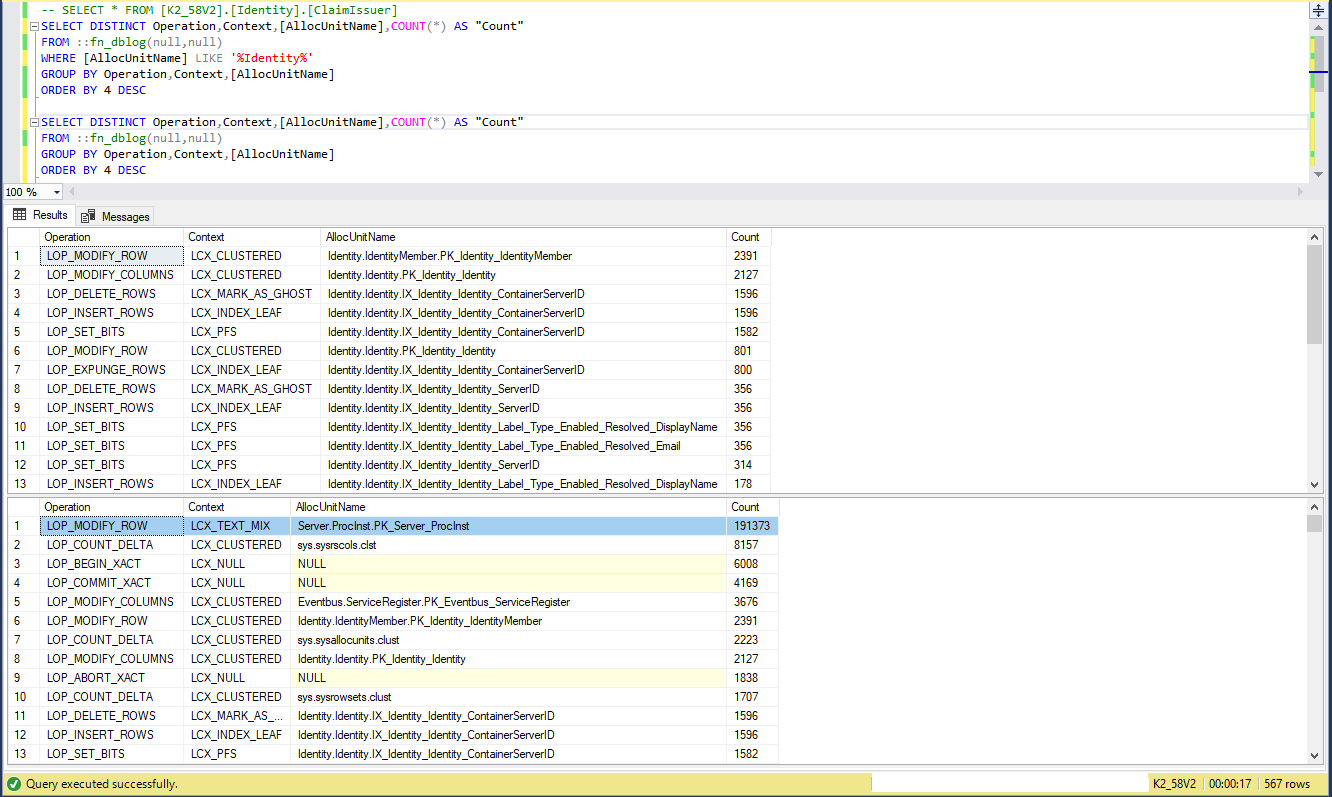
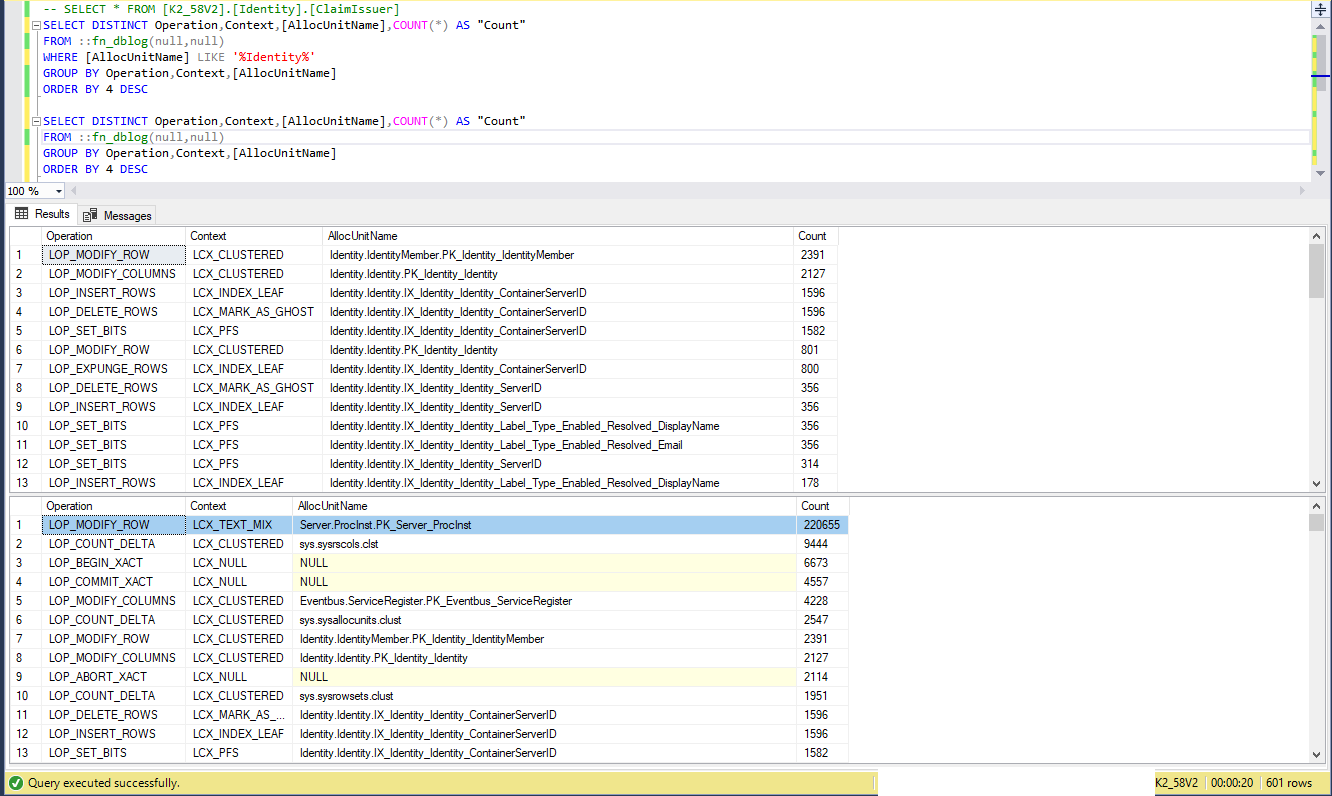
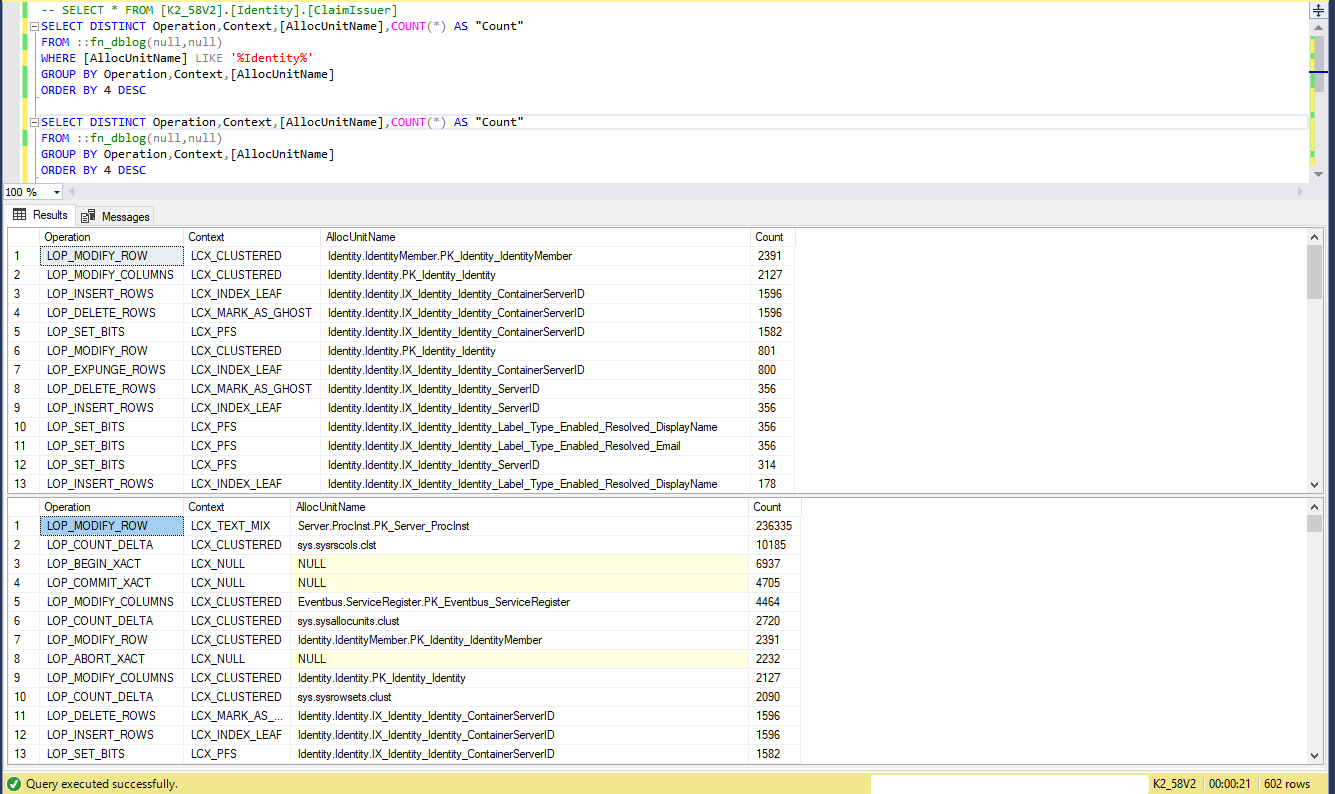
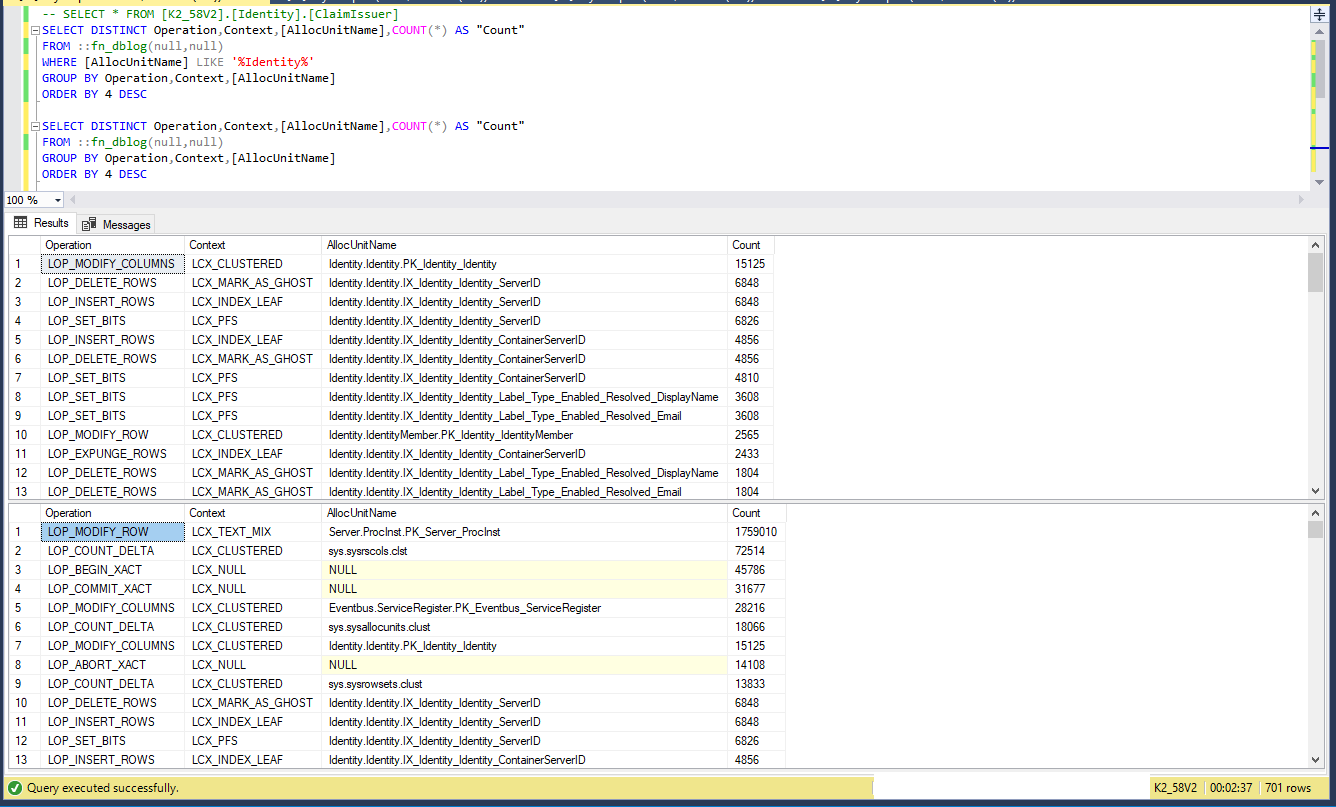
You can see a summary of the content of the Transaction log with the following queries:
SELECT DISTINCT Operation,Context,tAllocUnitName],COUNT(*) AS "Count"
FROM ::fn_dblog(null,null)
WHERE EAllocUnitName] LIKE '%Identity%'
GROUP BY Operation,Context,tAllocUnitName]
ORDER BY 4 DESC
SELECT DISTINCT Operation,Context,COUNT(*) AS "Count"
FROM ::fn_dblog(null,null)
GROUP BY Operation,Context
ORDER BY 3 DESC
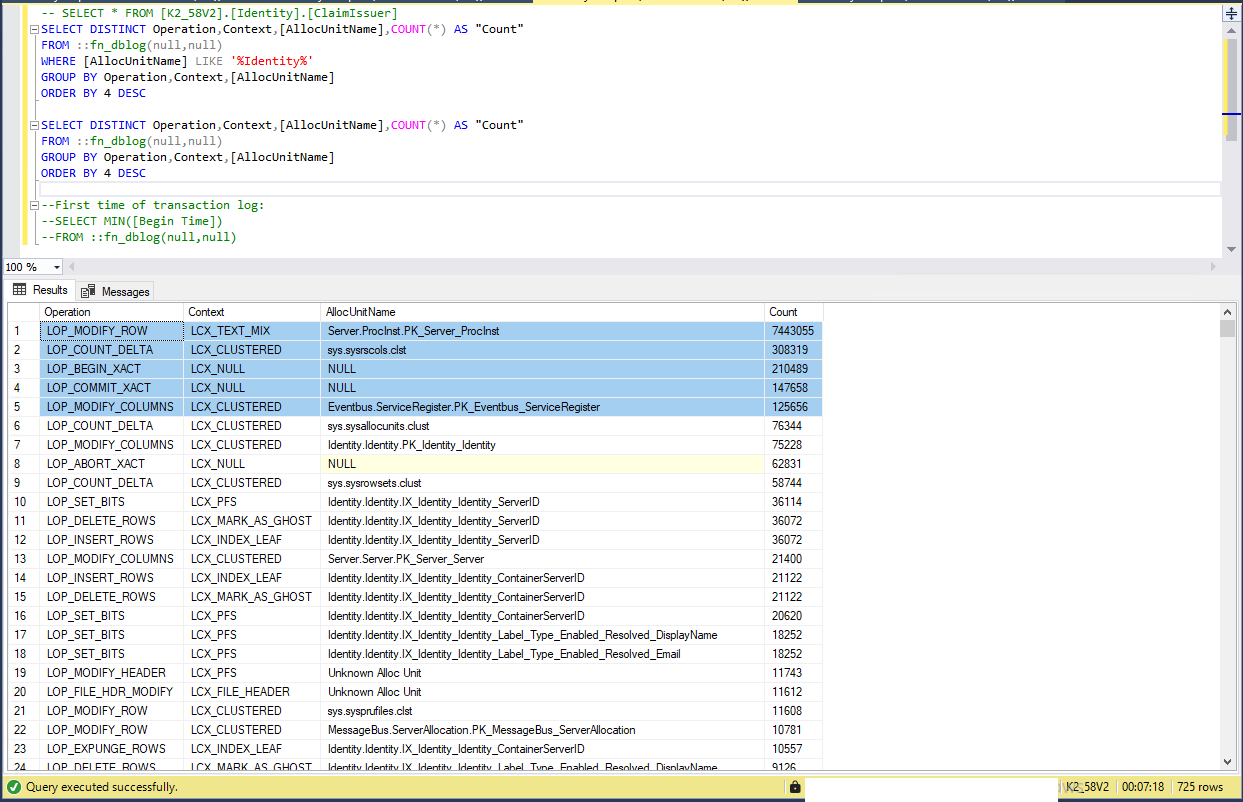
SELECT MIN( Begin Time])
FROM ::fn_dblog(null,null)
We recently experienced the same issue of the transaction log growing at an unsustainable rate (900Gb+ in less than 2 days). It turned out that the SQL Server recorded a long running transaction and held locks on the server.kAsync table (found by ‘dbcc opentran’), but the spid for this transaction no longer showed in the sys.sysprocesses view.
Killing the abandoned spid in SQL Server and then executing a checkpoint caused the accumulated transactions in the log to commit and the transaction log could then be shrunk to a normal size.



Production Database:
1- Database Must be in Full Mode Option.
2- This is trace of how transaction database grow rapidly.
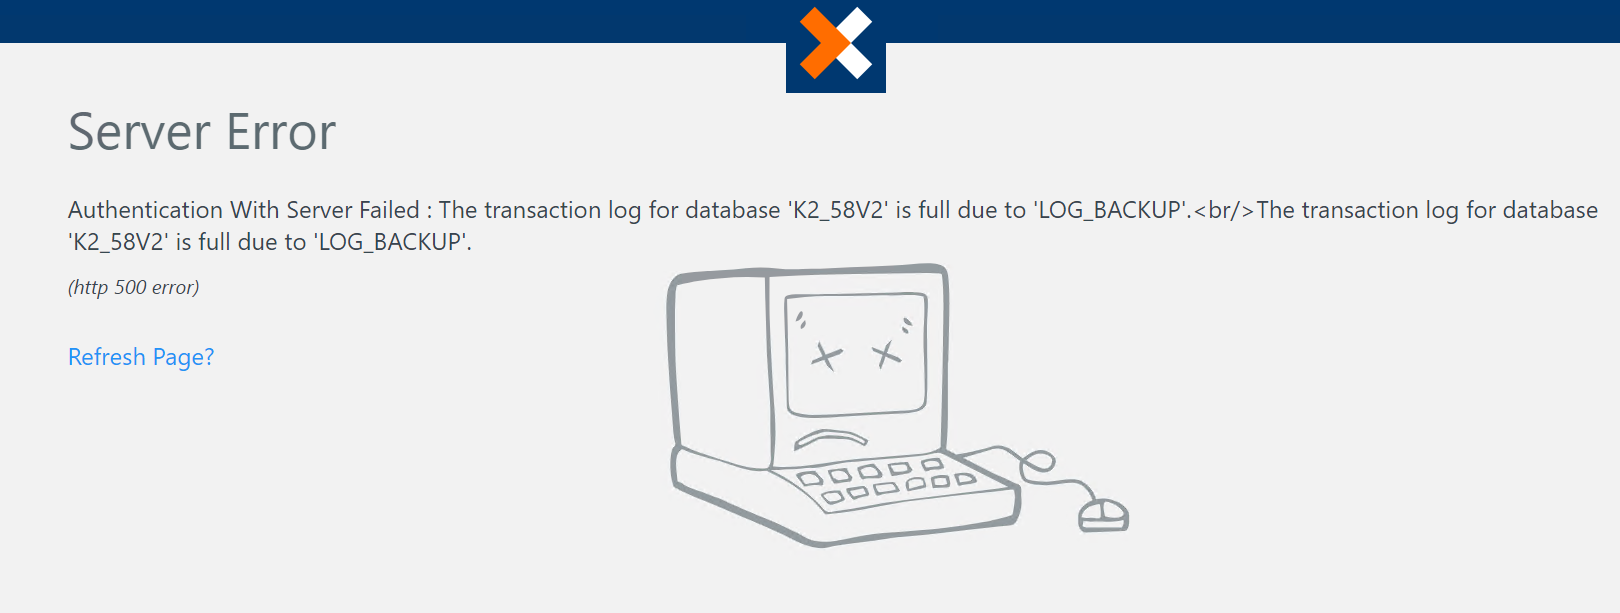
Finally: we need straight forward best practice for this PROBLEM, and if it is not K2 thing,
we need the not K2 thing solution to solve The K2 PROBLEM.
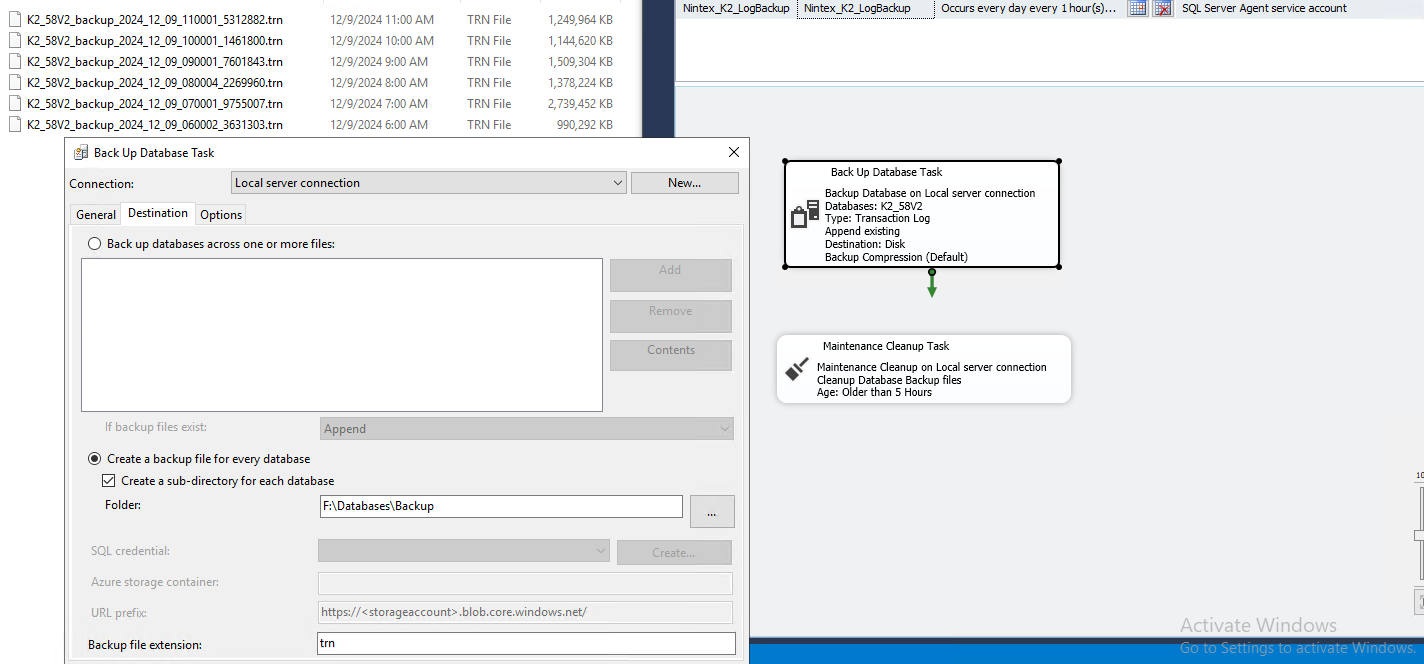
As a temporary solution, create schedule job backup transaction database log every one hour, and create another schedule to delete trn files every 5 hours or set time.
Reply
Enter your E-mail address. We'll send you an e-mail with instructions to reset your password.

