

How to enable Performance Monitoring on the K2 Service
KBS100072
PRODUCT- K2 Five
- K2 blackpearl
- K2 smartforms
- K2 blackpearl (all)
- Troubleshooting Document
- Contact Support KB
- Troubleshooting Tool
Issue
When using the K2 Product, you may experience slow performance with the various K2 Products - you may notice it when you are designing new processes or when you are trying to action your worklist items.Symptoms
You may notice that the K2 Service is using a high amount of resources on your environment, and that your CPU and Memory usage are "spiking", which results in poor performance on your environment.Troubleshooting Steps
K2 recommends keeping your K2 environment updated by installing the latest cumulative update, and that you test this update before you deploy to a production environment.
If you notice the problem is still occurring, it is possible to identify the problem by enabling Performance monitoring on the K2 Service.
- Open the Windows Performance Monitoring tool
- Go to the following path (Data Collector Sets > User Defined)
- Right click on “User Defined”, and click “New Data Collector Set”
- Give it a name, and select “Create data logs”, “Performance Counter”
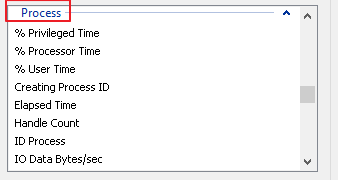
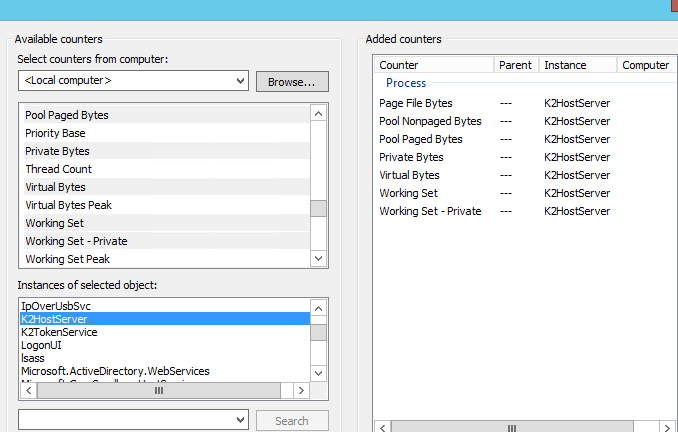
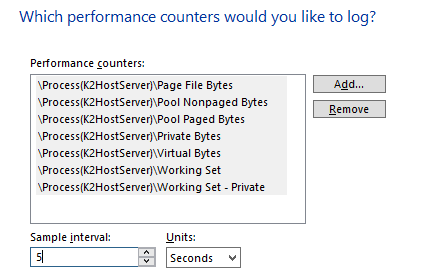
- Add the following performance counters under the "Process" counter:
Note: Remember to select the K2HostServer
- Set the interval to 5 seconds
- Save and Close
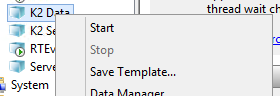
- Right click and click Start.
Please note
- Only run the performance monitoring for a set period
- If you are unable to identify the root cause of this issue, our developers and support team will be able to track down the root cause of the issue you are facing by looking at this data.
