

Analyzing memory dumps using DebugDiag 2 Analysis
KBS100074
PRODUCTIssue
There are 2 types of memory dumps that you can take:
- Hang Dump: A hang is when a software program becomes unresponsive. If you open the Windows task manager, the program still displays in the task manager, but doesn't consume high CPU power and doesn’t serve any new pages.
- Crash Dump: A crash is when a software program stops working and then closes. When this occurs, Windows usually creates an entry in the event log to help diagnose the problem.
Symptoms
You may notice that the K2 Service is using a high amount of resources on your environment, and that your CPU and Memory usage are "spiking", which results in poor performance on your environment.
Or, you may notice that your K2 Server stops unexpectedly.
Troubleshooting Steps
1. Get a copy of Debug Diag 2 Analysis
https://www.microsoft.com/en-us/download/details.aspx?id=49924
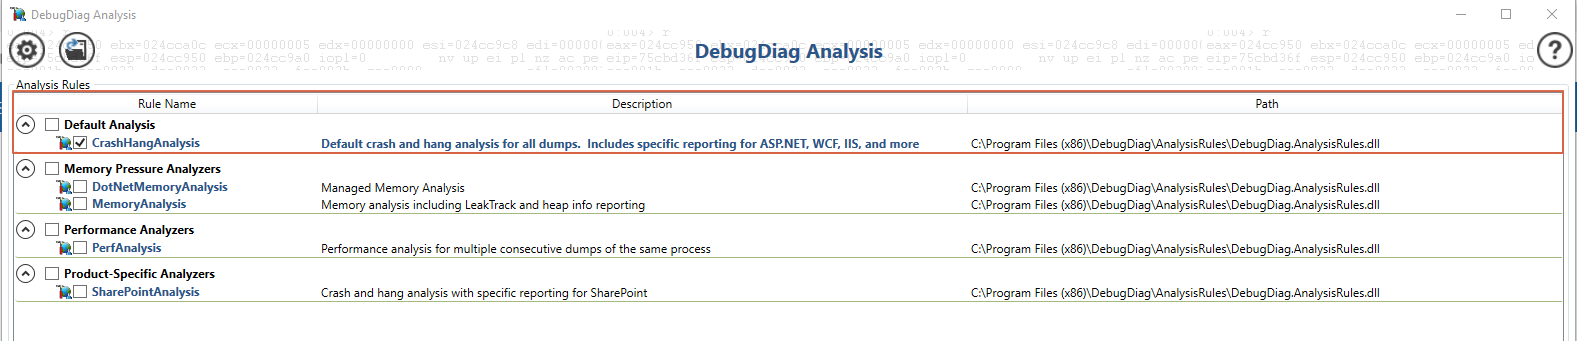
2. In Debug Diag there are 5 different Analysis Rules
- CrashHangAnalysis - Crash and Hang Analysis with specific reporting for ASP, .net, WCF, IIS and more
- DotNetMemoryAnalysis - Managed Memory Analysis (Beta version)
- MemoryAnalysis - Memory Analysis including Leaktrack and heap info reporting
- PerfAnalysis - Performance analysis for multiple consecutive dumps of the same process
- SharePointAnalysis - Crash and Hang Analysis with specific reporting for SharePoint
For more information regarding these rules please visit the following:
https://support.microsoft.com/en-ph/help/2895198/debug-diagnostics-tool-v2-0-is-now-available
3. For these troubleshooting steps, we will be using: Default Analysis > CrashHangAnalysis:
4. Click on the 'Add Data Files' button and select the Crash or Hang Memory Dump:
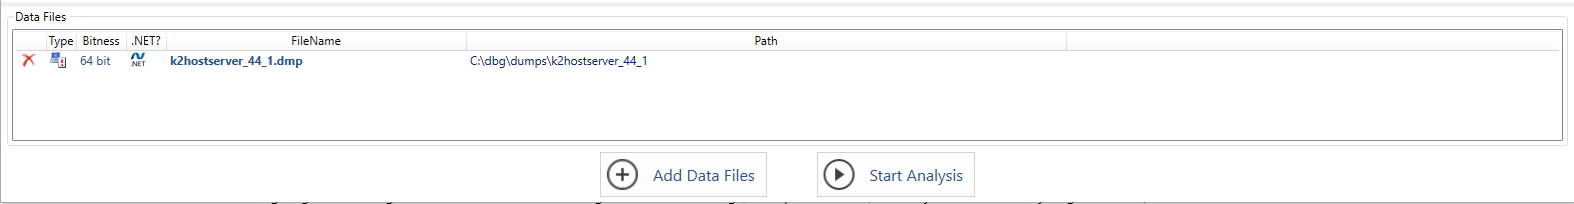
5. Click on 'Start Analysis' and let Debug Diag run its Analysis
6. Once completed, an Internet Explorer page will open with a message at the bottom warning about restrictions on the web page - Click on 'Allow blocked content':

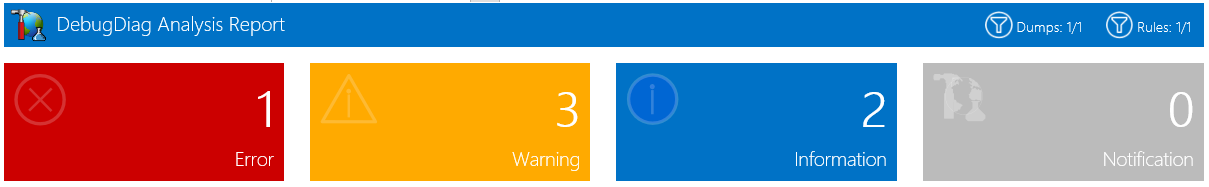
7. At the top of the report there are 4 sections (Error / Warning / Information / Notification) - Clicking on any of these will navigate you to the relevant sections:
Crash Dump:
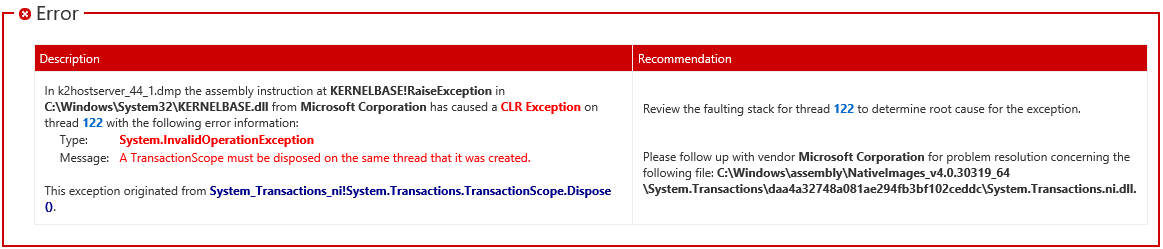
A process crash is usually indicative of an unhandled exception occurring in a process or code running in a process that actively terminates the process.
Click on the Error section to review the error that caused the crash.
Example of Error:
Hang Dump:
A process hangs when it stops responding completely or takes a long time to respond. Sometimes this slow response is accompanied by high CPU utilization.
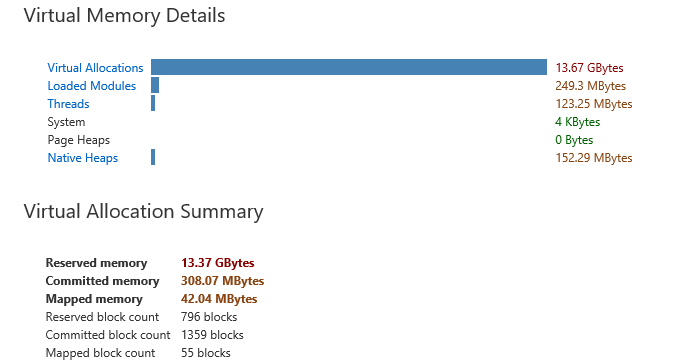
High memory usage: High memory usage or memory leak can cause virtual memory usage in a process to keep growing over time and prevent it from ever returning to normal usage levels. The process can then run out of memory and this can cause it to terminate unexpectedly.
Debugging these issues is a bit tricky, you will have to look through the report to determine which objects are consuming the most resources.
Have a look at the Virtual Memory Summary and Virtual Memory Details:
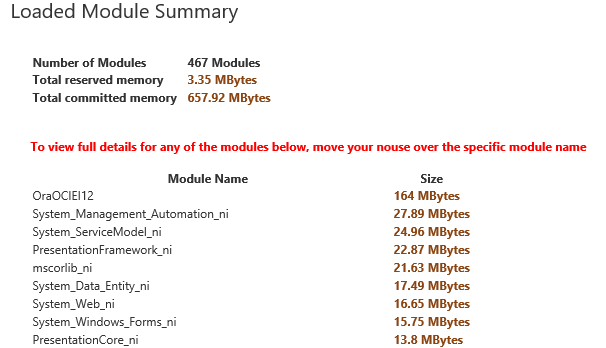
You can also see the Objects that are using the most memory in the 'Loaded Module Summary' section:
All dump files should be accompanied by the mscordacwks.dll and SOS.dll files for the specific .NET version the K2 Service is running under. (C:WindowsMicrosoft.NETFramework64v4.0.30319mscordacwks.dll)
- C:WindowsMicrosoft.NETFrameworkv2.0.50727mscordacwks.dll
- C:WindowsMicrosoft.NETFrameworkv2.0.50727sos.dll
- C:WindowsMicrosoft.NETFramework64v2.0.50727mscordacwks.dll
- C:WindowsMicrosoft.NETFramework64v2.0.50727sos.dll
- C:WindowsMicrosoft.NETFrameworkv4.0.30319mscordacwks.dll
- C:WindowsMicrosoft.NETFrameworkv4.0.30319sos.dll
- C:WindowsMicrosoft.NETFramework64v4.0.30319mscordacwks.dll
- C:WindowsMicrosoft.NETFramework64v4.0.30319sos.dll
