K2 Five workflow - long wait time before entering a "decision" block

  • 14 October 2021
  • 4 replies
  • 22 views

Badge +4

Hi,


I'm experiencing the following problem: in my workflow K2 stops and waits a long time (approx. 30 - 60 minuts) before entering a decision block. Execution of the previous step takes about 4s:


20086iB3343B327EA2C858.png

...but after that the process freezes in the "running" state (Server.ProcInst.Status = 1) and waits to enter next block:

20087i7C3C8B6F28749E97.png

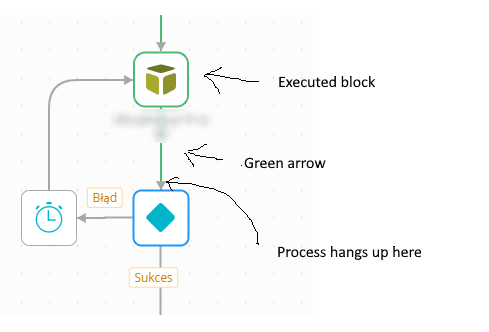
When the process finally enter the decision block, the block is executed in about 2 secunds.


What could be the reason?


Kind regards,

Peter


4 replies

Hi,


The flow maybe misleading. The workflow would have hit the decision in a few seconds. Check the decision itself. Are there any custom rules with the decision ? Second check to debug, put a notification email before the decision and after the decision. Check how long it takes to get both. I think your timer is the one causing the issue. Check and let me know how it goes.


Cheers

Badge +4

@AhmadAlbadri86, I think that the decision block has been reached but the time block hasn't. Activity status in the K2 database is:


//Check the decision itself. Are there any custom rules with the decision ?


Yes, there is one simple custom rule. It checks proces variable value:


Disable the rule within the decision and run it again. If it moves quicker, its definitely the rule. I realize in your rule says if "True" but true looks like a function. Try hardcoding true and run it agaib. Finally try reproducing the issue by creating same condition using another condition web part. Pinpointing the issue would help resolve it

Badge +4

It seems that I've finally solved the problem. It was some kind of a performance issue. There was a lot of outdated entries in the [Server].[Async] table. We also had many processes instances both waiting for external system (activity with checked option "Wait for the external system") and heaving active timer. Because of it all we had enormous processor and memory utilization on the appliaction server.


After all these processes had been processed, everything returned to normal. There are no outdated entries in the [Server].[Async] table. Application server resources utilization returned to normal to.


The question is: what was the root cause of the issue? Is the timer event so resource-consuming or mabey "Wait for the external system" option is?


Kind regards,


Piotr

Reply