I have created SQL table and then created service instance for that table and created smartobject and smartforms.
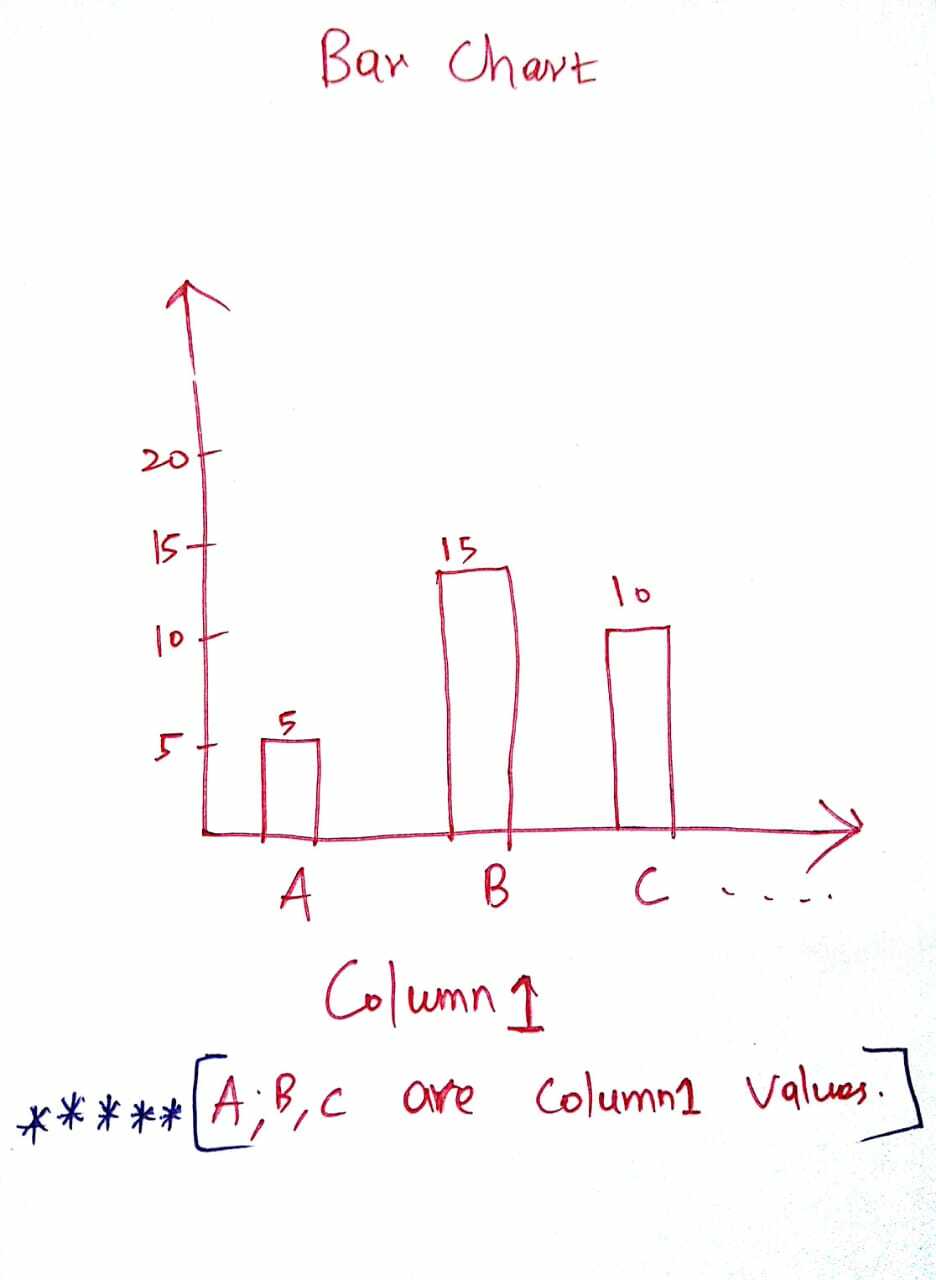
In the smartform i have a colums called "Column1". And Column 1 having values called A , B , and C.
I want to create a Bar chart report for Column 1 counts.[X - Column 1 values , Y - Column 1 counts]

Please help how to do in K2 Five out of box way. If not possible in out of box please provide other ways.