SQL Profiler Trace against your K2 Database
KB003526
PRODUCT
An SQL server profiler is a tool for tracing, recreating, and troubleshooting problems in MS SQL Server, Microsoft's Relational Database Management System (RDBMS). The profiler lets developers and Database Administrators (DBAs) create and handle traces and replay and analyze trace results
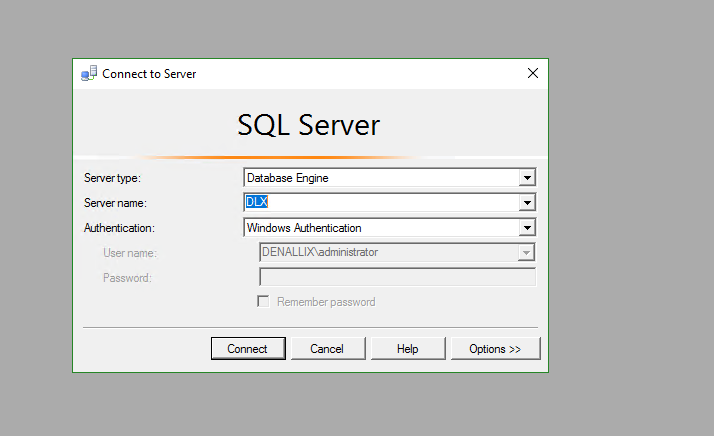
Open up SQL Server Management and connect to the SQL Server:
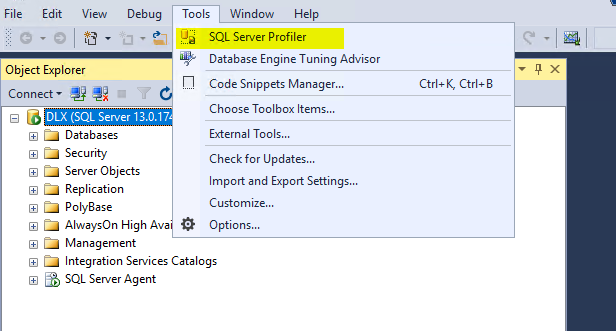
Navigate to tools > SQL Server Profiler:
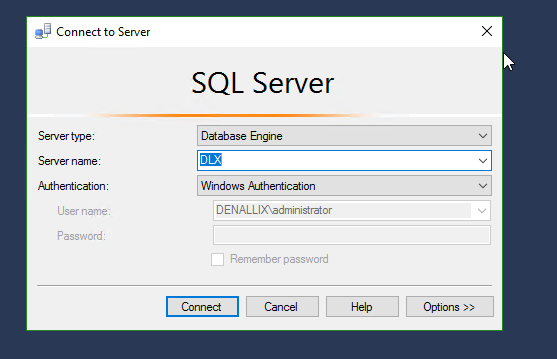
Confirm your SQL Server settings and click connect:
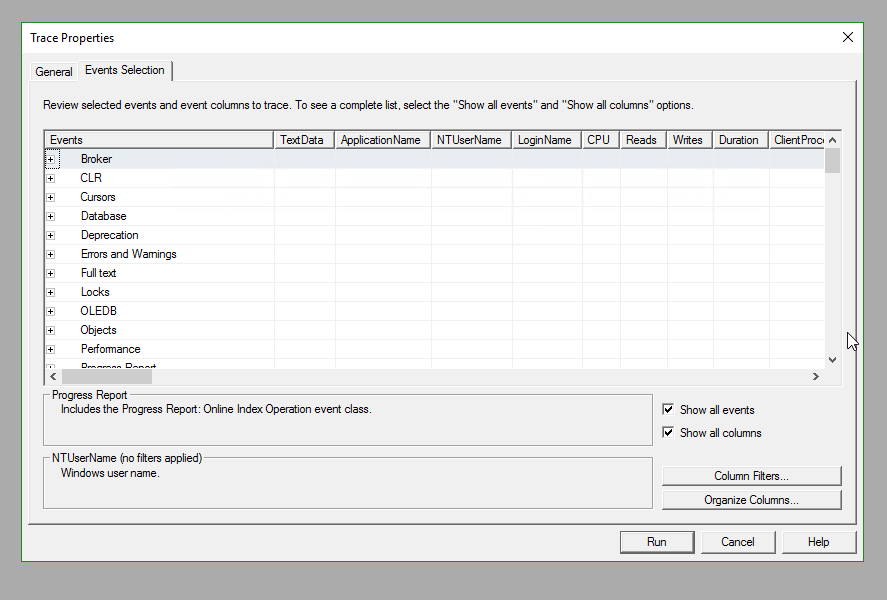
Navigate to the Events selection tab and select “show all events” and “show all columns”
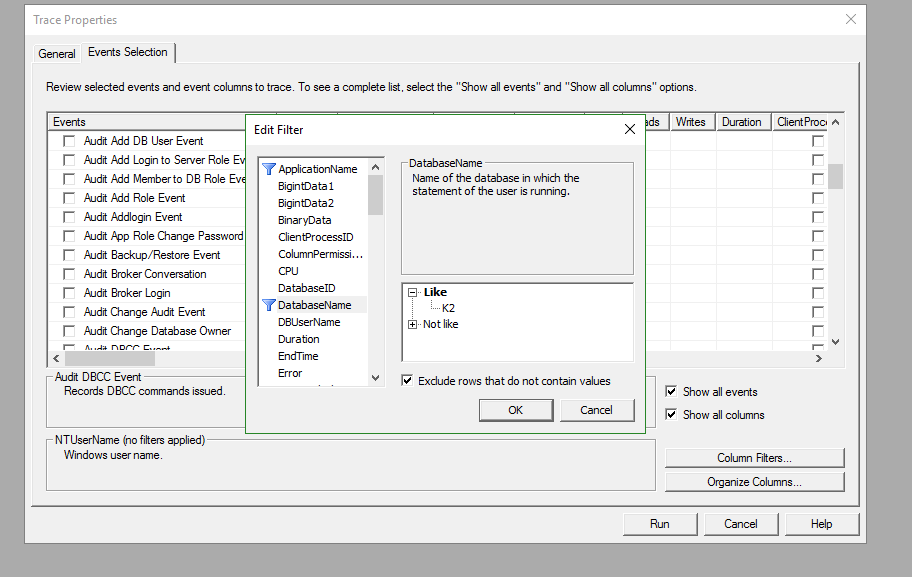
Click “column filters” button and navigate to the “Databasename” filter property and enter “Like” and match it to your K2 Database name and select “exclude rows that do not match this value”
Click “Run” and recreate the issue you are experiencing in K2 and stop the trace when you are done.
Go to “File” > “Save as” and select the “trace table” option and create a new table for debugging purposes.
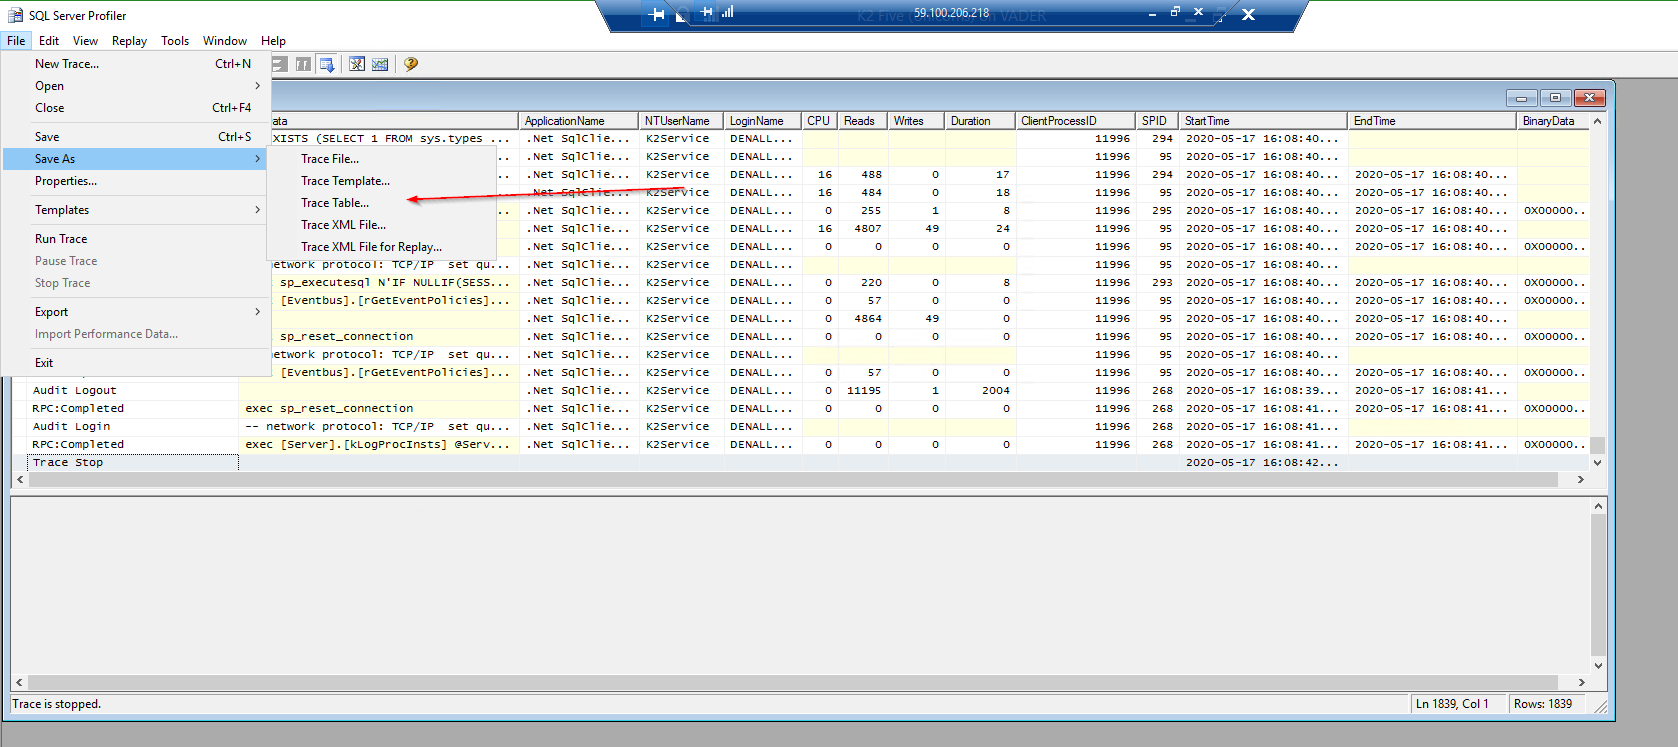
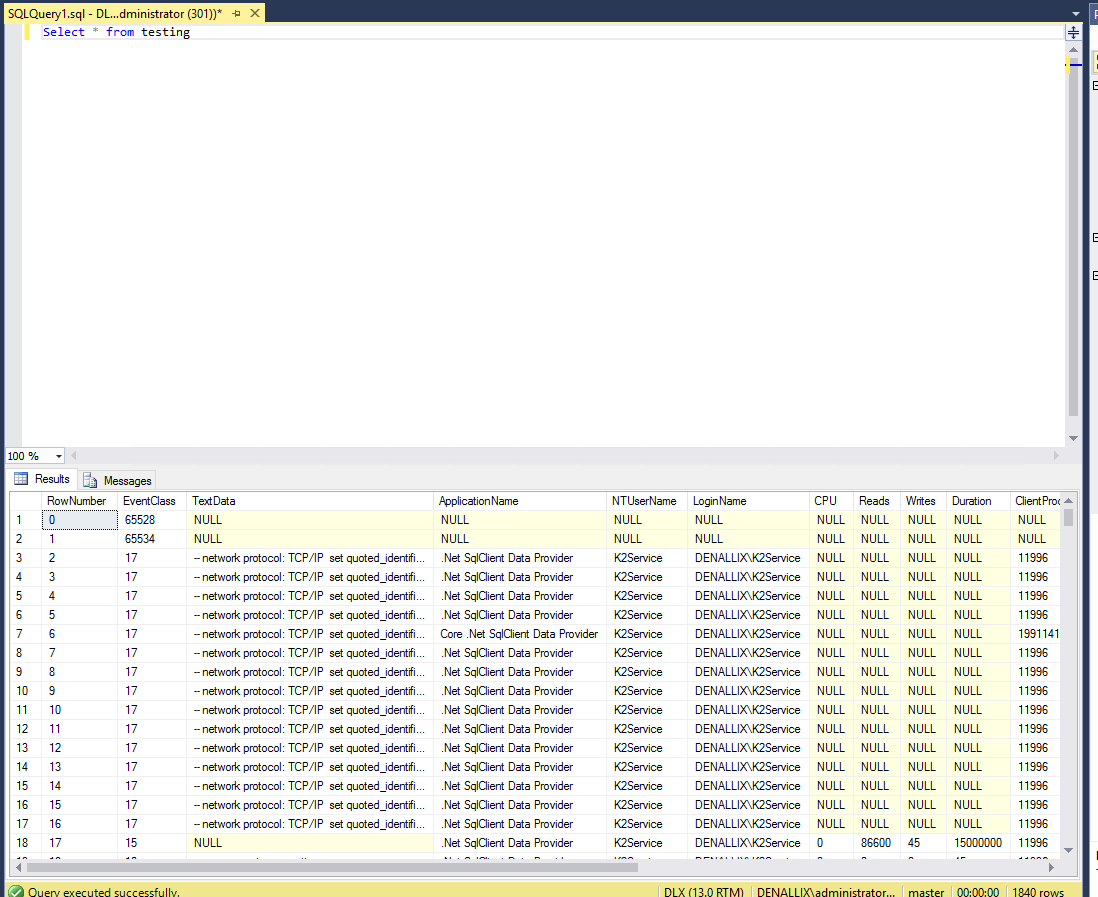
Once this is done you can load the table in SQL under the database this table was created and you can filter queries against the user that was performing the action to further isolate the issue that was being reproduced: